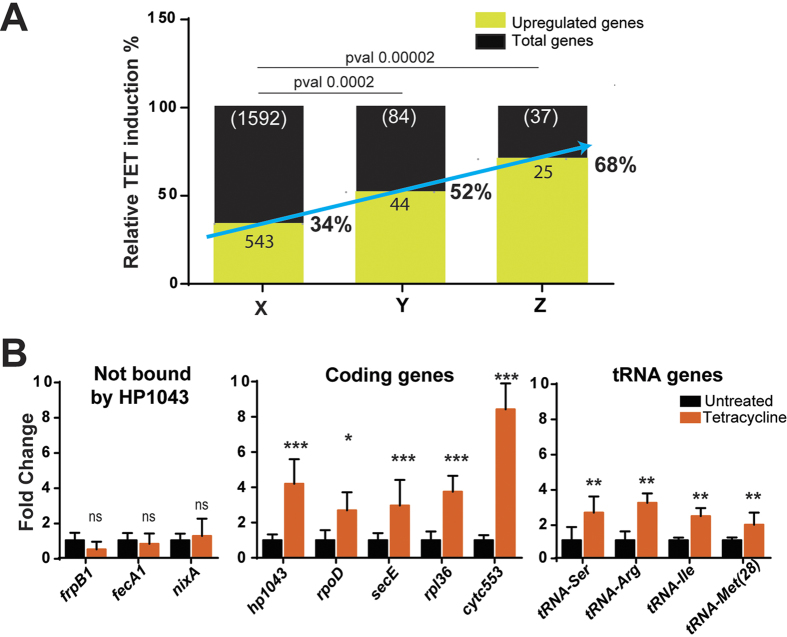
Figure 6.
RNA-seq (A) and Real Time PCR (B) analyses of transcript level variations of novel HP1043 targets in response to translation arrest. Panel A): relative percentage of the genes upregulated after tetracycline treatment considering all annotated H. pylori G27 genes (column X, with exclusion of rRNA genes, depleted during sample preparation), the genes in operons under direct control of HP1043 (column Y with exclusion of 2 rRNA genes and of the genes absent in H. pylori annotation: 4 antisense RNA, and 2 small RNA), and the genes leading the operons under direct control of HP1043 (column Z with the exclusion of the genes indicated for column Y), respectively. The reported p-value was calculated using Fisher test. Panel B): effect of tetracycline treatment on transcript amounts of a selection of genes associated with an HP1043 binding site assessed by real time (qRT-PCR) analysis. Total RNA was extracted from cells treated or not treated with 0.5 μg/ml tetracycline for 60 min and reverse transcribed to cDNA. Transcript levels of a selection of genes not associated (panel B, left graph) or associated (panel B, central graph) with an HP1043 binding site were quantified by qRT-PCR, using the housekeeping 16 S rRNA gene as control. The same analysis was carried out on some tRNA genes (panel B, right graph) associated with HP1043 binding. Statistically significant differences were assessed by Student’s t-test (Error bars indicate the standard deviation deriving from three independent biological samples, each analysed in duplicate technical replicates). Symbols: *p value < 0.05; **p value < 0.01; ***p value < 0.001; ns, p value > 0.05, not significant.

