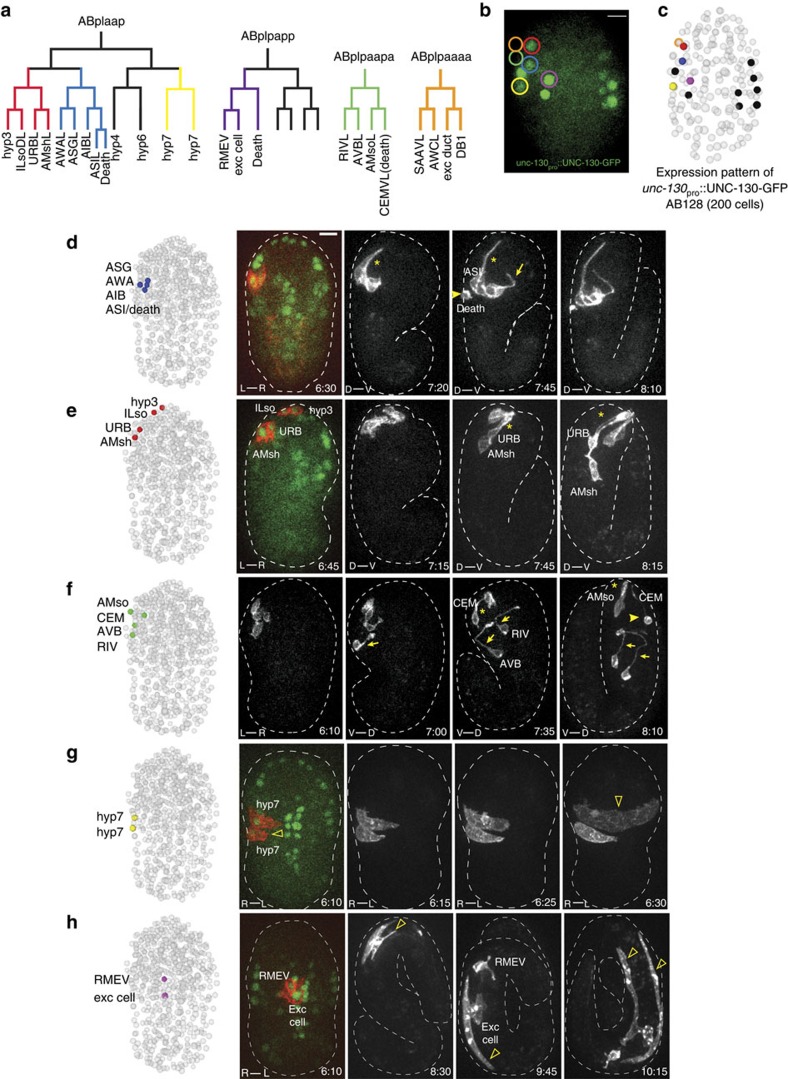
Figure 3. Infrared-laser-induction allowsvisualization of morphogenesis of diverse cell types.
(a) Cell lineages in which induction was performed. Colours correspond to experiments shown in d–h and Supplementary Movies 1–3. ABplpaaaa induction (orange) is shown in Supplementary Movie 3. (b) Expression pattern of UNC-130-GFP nuclear marker at AB128. Circled cells were targeted for labelling in separate experiments (d–h). Scale bar, 5 μm. (c) UNC-130-marked cells are shown on coordinates from a representative fully lineaged embryo27 at AB128. (d) Amphid neurons undergo retrograde dendrite extension (star) and axon extension ventrally and then dorsally into the nerve ring (arrow). ASI sister-cell death is visible (arrowhead). See Supplementary Movie 1. (e) Sensory glia and neurons are born near the nose-tip and extend retrograde processes (star). (f) Proximal axon segment of AVB and RIV (arrow), CEM-neuron early stages of death (arrowhead) are visible. See Supplementary Movie 2. (g) Hypodermal cell migration/fusion (open arrowhead). (h) Excretory cell elongation (open arrowhead). The (d–h) Labelled cells are shown on coordinates from a fully lineaged embryo after the final division is complete27 (left). The embryo axis of the imaging plane is shown at the bottom left of images. (D–V, dorsal–ventral; R–L, right–left). Note that the embryo turns 90o in the eggshell during morphogenesis (Supplementary Fig. 1). Times are given relative to comma stage (07:10; ref. 3). Scale bar, 5 μm.

