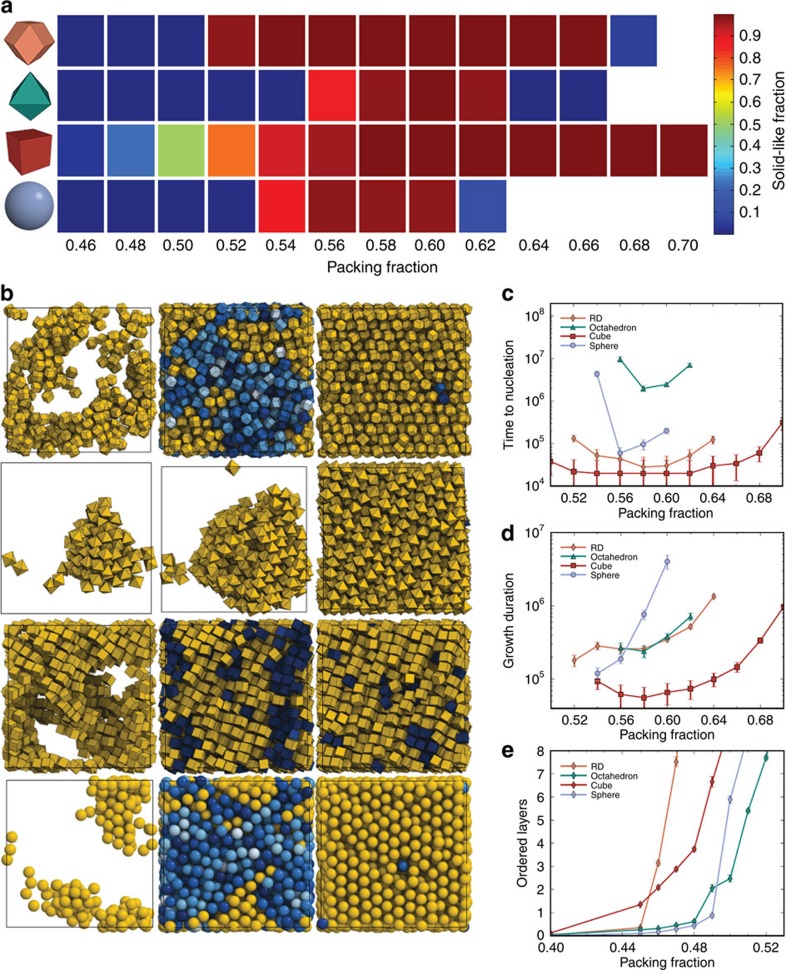
Figure 3. Crystallization of nanocrystal superlattices in Monte Carlo simulations of hard particles.
(a) Density range where homogenous nucleation and growth occurs for each particle shape using isochoric simulations starting from configurations rapidly compressed to a selected packing density. Rectangles in a density versus shape grid are coloured by the calculated system-average local order for rhombic dodecahedra, octahedra, cubes and spheres. Low values (blue) indicate disordered local structure (fluid), while high values (red) indicate crystalline order. Empty cells demarcate the regions beyond random close packing. Each data point represents the average of ten runs over 50 million Monte Carlo cycles. (b) Early, middle and late stage growth of homogeneously nucleating superlattices for rhombic dodecahedra, octahedra, cubes, and spheres. Densities are selected to represent a typical Monte Carlo trajectory for the particular shape. Crystallization may result from several nuclei. (c) Time to nucleate, as measured by the number of Monte Carlo cycles for the system to reach 20% crystallinity. (d) Time to grow, as measured by the time required to advance from 20 to 80% crystallinity. (e) Number of ordered layers equilibrated near hard boundaries at densities lower than where homogeneous nucleation occurs. The error bars in (c–e) correspond to the standard error of the mean.

