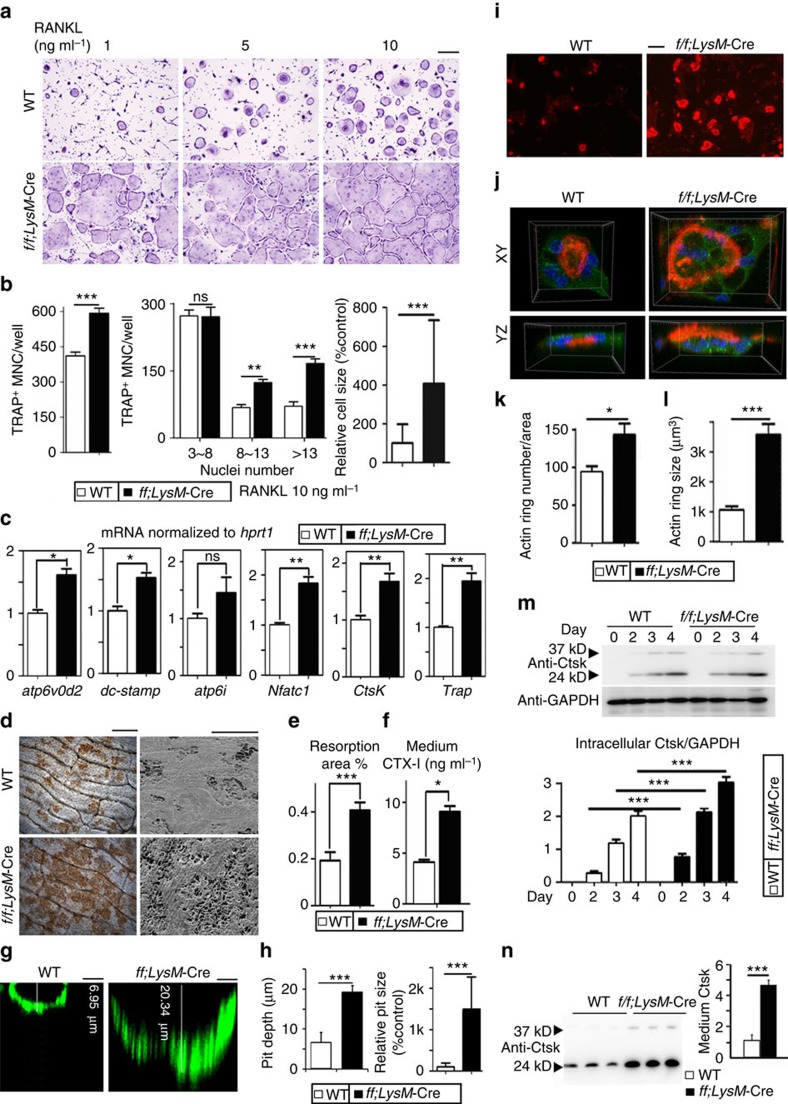
Figure 3. Loss of Gα13 promotes osteoclast formation and function.
(a) TRAP staining to detect osteoclast formation from WT and Gna13f/fLysM-Cre (f/f;LysM-Cre) BMMs treated by M-CSF and different doses of RANKL for 5 days. (b) Quantification of cell number and relative cell size in a, RANKL=10 ng ml−1 group; N=6. TRAP+ MNC, TRAP positive multinucleated cell. (d) Quantitative reverse transcription–PCR analysis of atp6v0d2, dc-stamp, atp6i, nfatc1, ctsk and trap expression in WT and Gna13f/fLysM-Cre osteoclasts; N=6. (e) WGA (wheat germ agglutinin) staining and SEM (scanning electron microscope) analysis of bone slides to detect bone resorption pits. (f) Quantification of bone resorption area in e; N=6. (g) Confocal microscopy of FITC-WGA stained bone resorption pits. (h) Quantification of bone resorption pit depth and relative pit size in g. Culture medium CTX-I (type I collagen carboxy-terminal peptide) concentration measured by ELISA. (i) Fluorescence microscopy of F-actin ring stain in mature osteoclasts. (j) Confocal microscopy of F-actin ring (red)/Ctsk (green)/nuclei (blue) staining in mature osteoclasts. (k) Quantification of F-actin ring number in i; N=6. (l) Quantification of F-actin ring volume in j; N=30. (m) Western blot to detect intracellular Ctsk protein level, and its quantification (lower panel); N=3. (n) Western blot to detect Ctsk concentration in the culture medium, and its quantification (right panel); N=3. Results are expressed as mean±s.d.; *P≤0.05; **P≤0.01; ***P≤0.001 (Student's t-test or ANOVA analysis). Scale bars in a,i,d, 200 μm; Scale bar in g, 5 μm.

