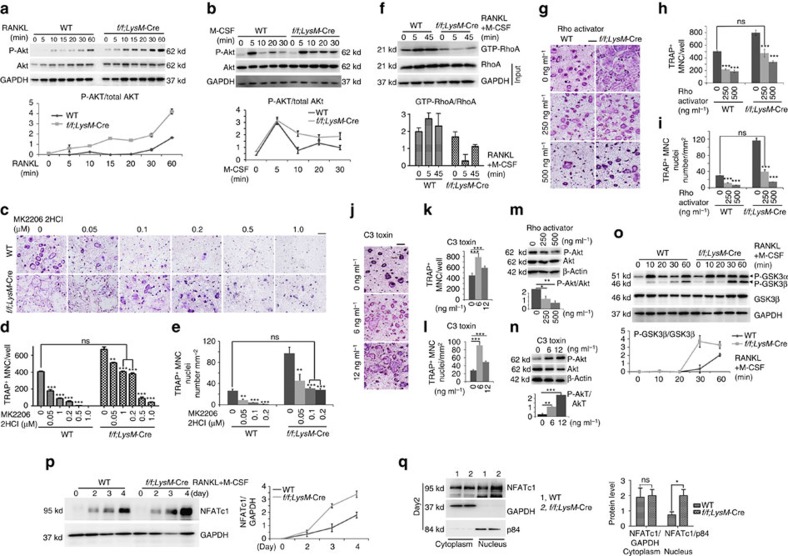
Figure 4. Knockout of Gna13 enhances Akt-GSK3β-Nfatc1 signalling through RhoA.
(a) Western blot analysis to detect Akt phosphorylation induced by RANKL in WT and Gna13f/fLysM-Cre (f/f;LysM-Cre) monocytes/macrophages. N=3. (b) Western blot analysis to detect Akt phosphorylation induced by M-CSF in WT and Gna13f/fLysM-Cre monocytes/macrophages. Lower panel in a–b, Quantification of phospho-Akt level versus total Akt level; N=3. (c) TRAP staining to detect osteoclastogenesis of WT and Gna13-deficient osteoclasts treated by MK2206 2HCl at different doses during differentiation. (d) Quantification of TRAP+ MNC number per well in c; N=6. (e) Quantification of TRAP+ nuclei number per mm2 in c; N=6. (f) RhoA activity in WT and Gna13f/fLysM-Cre pre-osteoclasts upon RANKL and M-CSF stimulation, and its quantification; N=3. (g) TRAP staining of WT and Gna13f/fLysM-Cre osteoclasts treated by Rho activator II at different doses during differentiation. (h) Quantification of TRAP+ MNC number per well in g; N=6. (i) Quantification of TRAP+ nuclei number per mm2 in g; N=6. (j) TRAP staining of WT and Gna13f/fLysM-Cre osteoclasts treated by different doses of RhoA inhibitor (C3 toxin) (0, 6, 12 ng ml−1) during differentiation. (k) Quantification of TRAP+ MNC number per well in j; N=6. (l) Quantification of TRAP+ nuclei number per mm2 in j; N=6. (m) Akt phosphorylation in pre-osteoclasts treated different doses of Rho activator II. (n) Akt phosphorylation in pre-osteoclasts treated different doses of C3 toxin (0, 1, 3, 6 ng ml−1). Lower panel in m–n, Quantification of phospho-Akt level versus total Akt level; N=3. (o) GSK3β phosphorylation induced by RANKL and M-CSF. Lower panel, Quantification of phospho-GSK3β level versus total GSK3β level; N=3. (p) Western blot analysis of NFATc1 expression in WT and Gna13f/fLysM-Cre osteoclast precursors. (q) NFATc1, GAPDH (cytoplasm loading control) and p84 (nuclei loading control) in Nuclei and cytoplasm lysates of WT and Gna13f/fLysM-Cre pre-osteoclasts. Right panels in p–q, Quantification of NFATc1 level versus loading control; N=3. Results were expressed as mean±s.d.; *P≤0.05; **P≤0.01; ***P≤0.001 (Student's t-test or ANOVA analysis). Scale bars, 200 μm.

