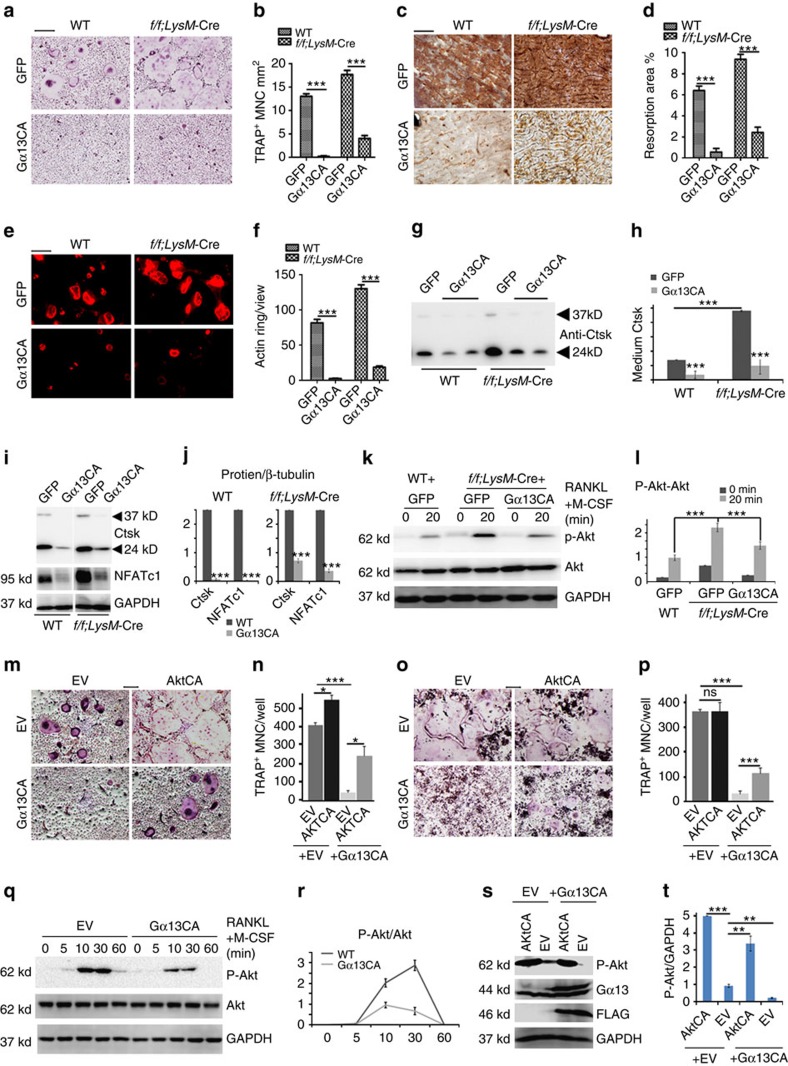
Figure 5. Gα13 gain-of-function inhibits osteoclast formation and function in vitro.
(a) TRAP staining to detect osteoclastogenesis of WT and Gna13f/fLysM-Cre (f/f;LysM-Cre) cells transfected with lentivirus overexpressing green fluorescent protein (GFP) and Gα13CA. (b) Quantification of TRAP+ MNC number per mm2 in a; N=6. (c) WGA staining to detect bone resorption of WT and Gna13f/fLysM-Cre cells overexpressing GFP and Gα13CA. (d) Quantification of bone resorption area per total area in c; N=6. (e) Rhodamine-conjugated-Phalloidin staining to detect F-actin ring formation of WT and Gna13f/fLysM-Cre cells transfected with lentivirus overexpressing GFP and Gα13CA. (f) Quantification of F-actin ring number per view in e; N=6. (g,i,k) Western blot to detect medium Ctsk (g), osteoclast-specific gene expression (i) Akt phosphorylation induced by RANKL and M-CSF (k) in WT and Gna13f/fLysM-Cre osteoclasts (overexpressing GFP or Gα13CA). (h,j,l) Quantification of protein level in g–l; N=3. (m,o) TRAP staining to detect osteoclastogenesis of BMMs (m) and RAW264.7 cells (o), which were transfected with control retrovirus and retrovirus overexpressing 3xFLAG-Gα13CA, AktCA or 3xFLAG-Gα13CA+AktCA. (n,p) Quantification of TRAP+ MNC per well in n,m and in p,o; N=6. (q,r) Western blot analysis of RANKL induced Akt phosphorylation in RAW264.7 cells transfected with control retrovirus and retrovirus overexpressing Gα13CA, and its quantification; N=3. (s,t) Western blot confirmation of AktCA and Gα13CA overexpression in RAW264.7 cells, and its quantification; N=3. EV, empty vesicle control. Results were expressed as mean±s.d.; *P≤0.05; **P≤0.01; ***P≤0.001 (Student's t-test or ANOVA analysis). Scale bars, 200 μm.

