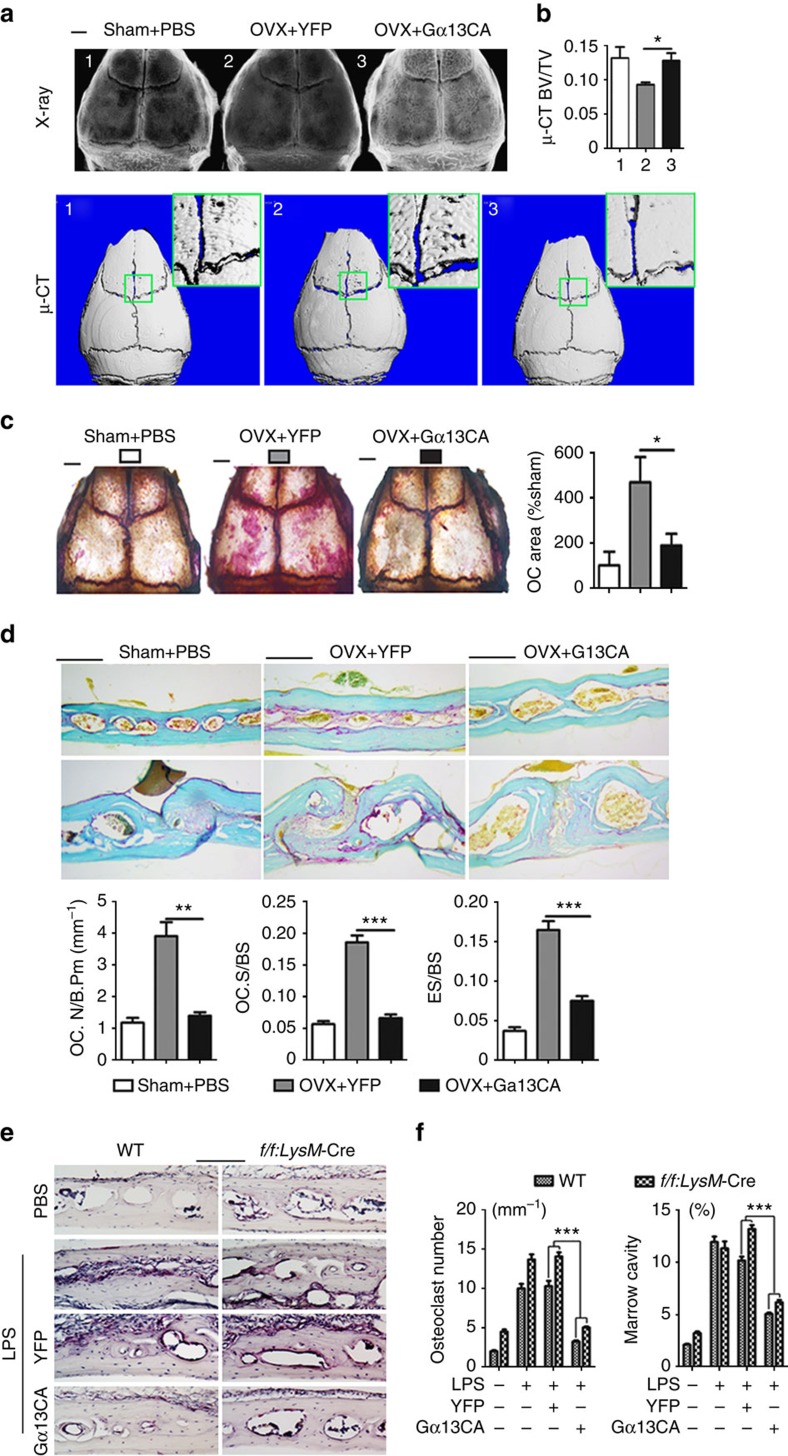
Figure 7. Gα13 protects mice from OVX- and LPS-induced bone loss.
(a–d) Histology analysis of calvarial bones from 13-week-old female sham-operated mice (control), and ovariectomized (OVX) mice injected with AAV-YFP or AAV-Gα13CA. (a) Radiographic (higher panels) and μ-CT analysis (lower panels). High-magnification images are co-presented in the right corners. (b) Quantification of bone volume per tissue volume (BV/TV); N=3. (c) Whole calvaria TRAP staining; Quantification of relative TRAP positive area is co-presented on the right panel; N=4. (d) TRAP staining of calvaria frozen sections. Quantification of osteoclast and bone resorption metrics are presented in lower panel; OC.N/B.Pm, osteoclast number per bone perimeter; OC.N/BS, osteoclast number per bone surface; ES/BS, eroded surface per bone surface; N=4. (e) TRAP staining using frozen sections of calvarial bones from 8-week-old male WT and Gna13f/fLysM-Cre (f/f;LysM-Cre) mice treated with PBS, LPS, LPS+AAV-YFP or LPS+AAV-Gα13CA. (f) Quantification of TRAP-positive cells per bone surface and marrow cavity area in e; N=6. Results were expressed as mean±s.d.; *P≤0.05; **P≤0.01; ***P≤0.001 (Student's t-test or ANOVA analysis). scale bars in a,c 200 μm; scale bars in d,e, 1 mm.

