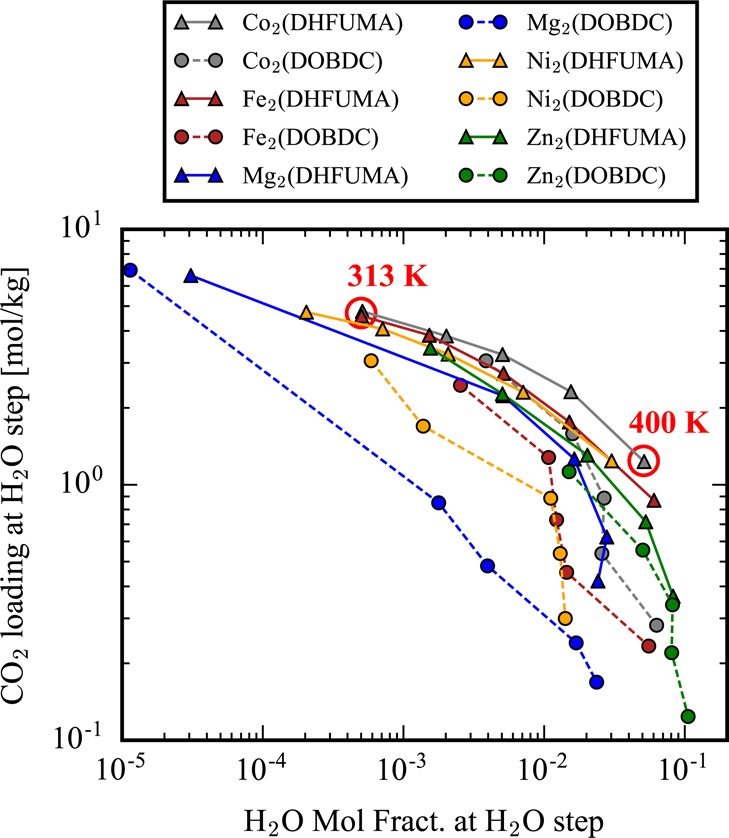
Figure 8.

Mixture analysis of all analogues demonstrating the competing nature of CO2 uptake and water tolerance. The y-axis corresponds to value (1) extracted from Figure 7, and the x-axis corresponds to value (2). The ideal material for CO2 capture would have a data point corresponding to 313 K at the top right corner of the plot.
