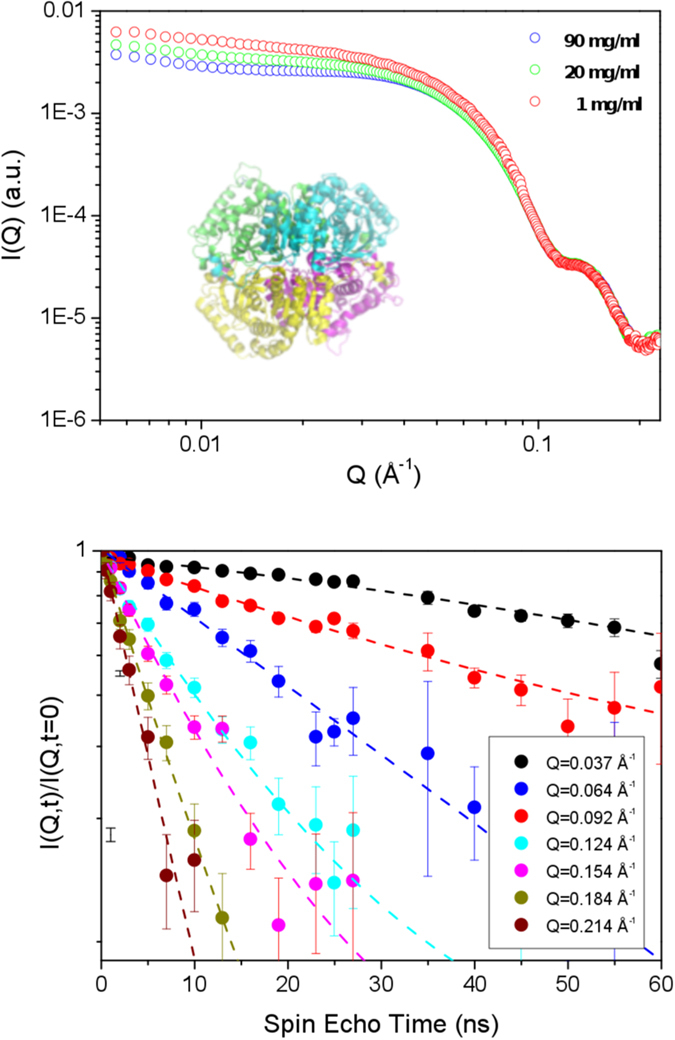
Figure 1. SANS and NSE scattering curves.

The upper panel shows the SAXS scattering curves as a function of Q, rescaled to the protein concentrations, and a graphical representation of the protein structure in the inset, where different colors correspond to different subunits.The lower panel shows the intermediate scattering function I(Q, t)/I(Q, 0) as a function of the spin-echo time (circles) measured at T = 298 K, shown for different Q along with the fits to the data (lines).
