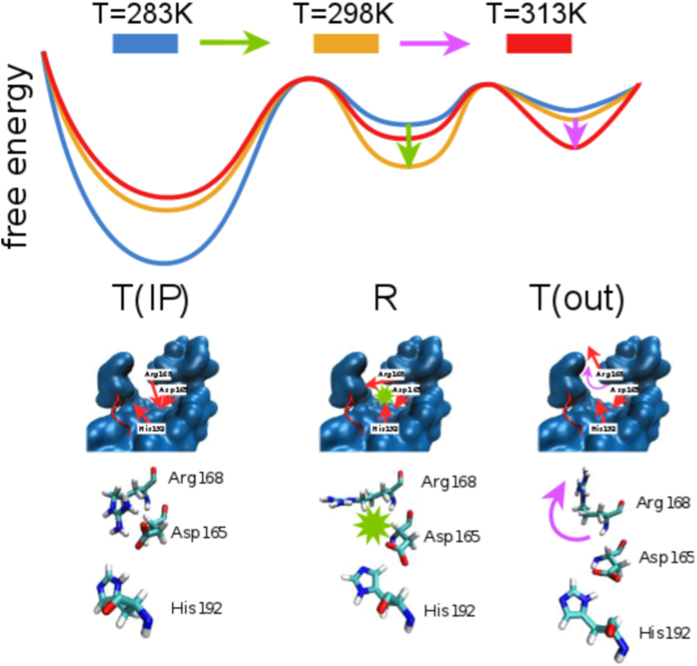
Figure 6. Schematic representation of changes in relative populations of states sampled in the simulations: T(IP) - inactive (T) state with ion pair (IP) formed between Arg168 and Asp165, R - active state, T(out) - inactive state where Arg168 points outside of the active site (out).
Increasing the temperature to T = 298 K allows for sampling of the active state (R) by breaking the Arg168-Asp165 ion pair (marked by a green star and arrow) and allowing the Asp165 and His192 to interact. Further increase in temperature deactivates the enzyme (T), and causes the rotation of the Arg168 sidechain outside of the active site (out), shown by a purple arrow. The portion of the protein shown in blue is surrounding the active site, while the catalytic loop is shown in red. The red arrows show the side chain orientation in the middle panel. The lowest panel shows the three amino acids from the simulation snapshots.

