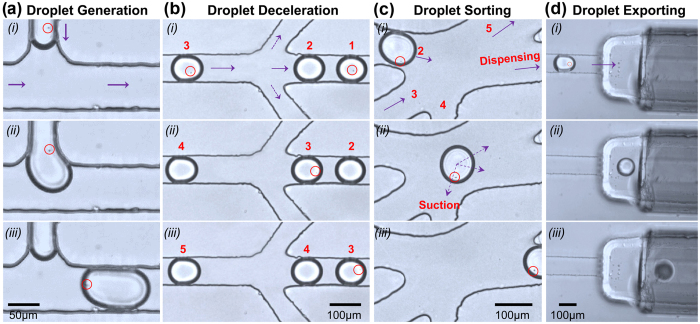
Figure 2. The process of single-cell droplet isolation under microscope.
(a) Droplet generation at the “T junction” of the microchannels. (b) Droplet deceleration at the inspection zone. (c) On-demand droplet sorting by the solenoid valve. (d) Export of single-cell droplets through the dispensing channel. Photos were taken with time intervals 0-0.92-1.2 s, 0-0.7-1.4 s, 0-0.2-0.4 s and 0-0.24-0.44 s for (a), (b), (c), (d) respectively. Each photo showed roughly the whole microscope field of this step respectively.

