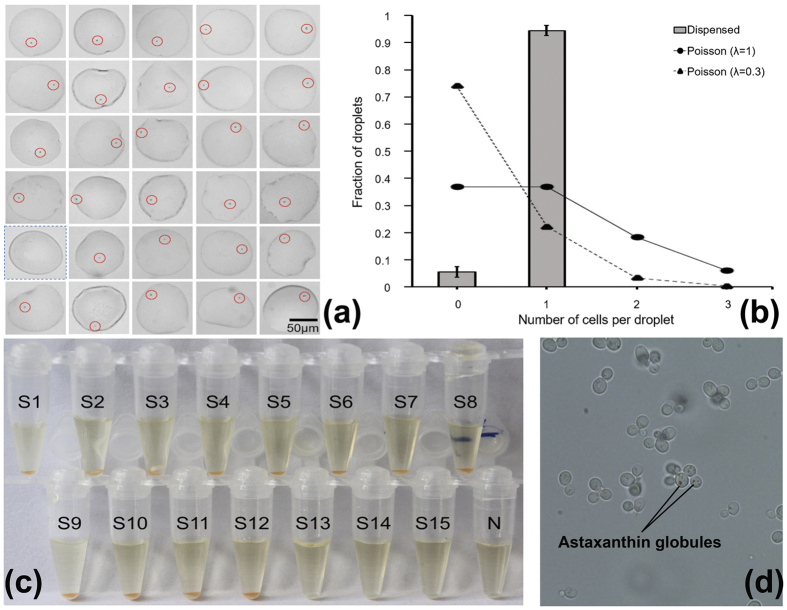
Figure 3. Evaluation of the single-cell droplet isolation.
(a) Each sorted droplet was dispensed on a glass slide and the number of cells in each droplet was counted under microscope. Single cells were marked with red circles; droplets without cells were marked with blue-dotted boxes. Size and shape of droplets varied due to their expansion on the glass slide. One of the triplicates was shown. (b) The ratio of single-cell droplets (gray block) compared with the theoretical ratio of single-cell droplets when formed at the “T-junction” of the microchannels (λ = 0.3, black triangle) and the upper limit of single-cell droplets (λ = 1, black circle). (c) Result of the single-cell cultivation experiment. S: single-cell samples; N: blank droplet. (d) Microscopic images of P. rhodozyma cells from one of the tubes in (c).

