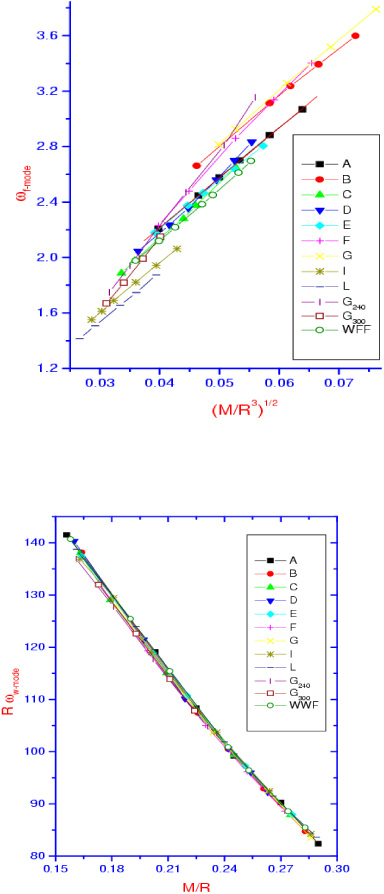
Figure 7.

The upper graph shows the numerically obtained f-mode frequencies plotted as functions of the mean stellar density. In the second graph the functional Rωω is plotted as a function of the compactness of the star (M and R are in km, ωf-mode and ωw-mode in kHz). The letters A, B, C, … correspond to different equations of state for which one can refer to [19].
