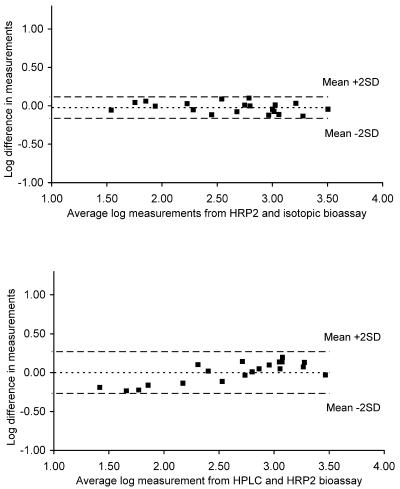
FIG. 3.
Bland-Altman plots of the agreement of plasma level measurements from the HRP2 bioassay and the isotopic bioassay (mean difference on a log scale, −0.02; limits of agreement, −0.164 and 0.118), as well as from the HRP2 bioassay and HPLC-ECD (mean difference on a log scale, 0.00; limits of agreement, −0.269 and 0.271).

