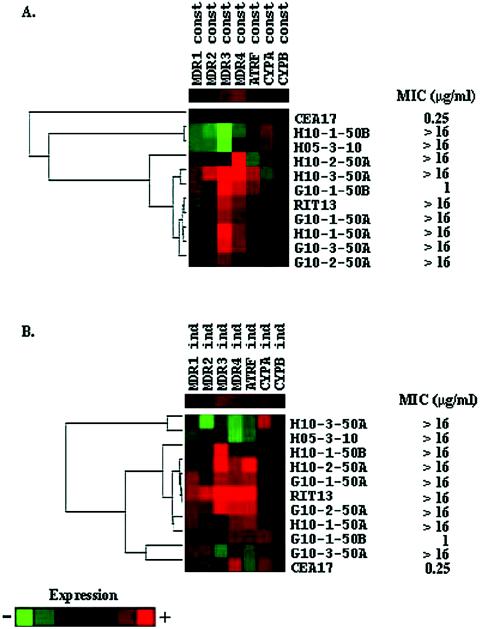
FIG. 1.
Hierarchical clustering showing the gene expression profiles of seven different A. fumigatus genes during growth in the absence (A) and in the presence (B) of itraconazole. In both experiments, the relative levels of each transcript were monitored by real-time RT-PCR of mRNA extracted after 24 h of growth. These values were log2 transformed and submitted to a hierarchical clustering algorithm by using the default parameters of CLUSTER software, kindly provided by M. Eisen and available at http://www.microarrays.org/software.html. In both cases, as shown by the scales on the right, a color scheme was used to designate genes that were down-regulated (green) or up-regulated (red). The clustering, along with the resulting dendrogram, was displayed by using TREEVIEW software, also available at the URL mentioned above (10).

