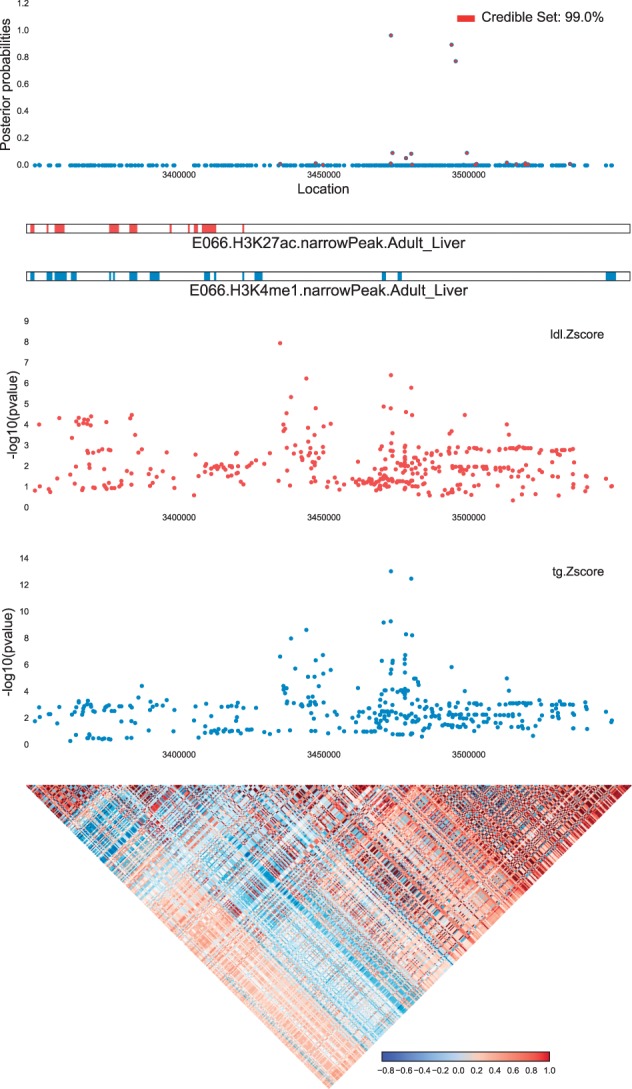
Fig. 1.

Example of input and output of fastPAINTOR at locus chr4:35Mb for LDL and TG. As input, fastPAINTOR receives an LD matrix, functional annotations and multiple sets of Z-scores at the given locus. fastPAINTOR performs inference and outputs posterior probabilities for each SNP that quantifies the likelihood that the SNP is causal for both traits (Color version of this figure is available at Bioinformatics online.)
