
Fig. 4.
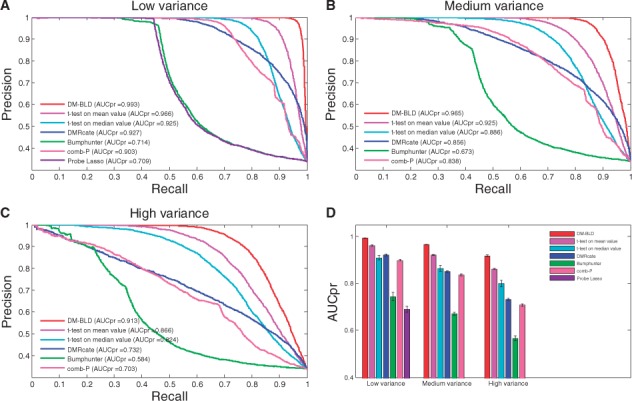
Performance on the detection of differentially methylated genes at varying noise levels. Precision-recall curves: (A) low variance; (B) medium variance; (C) high variance. (D) AUCpr in each scenario with 10 experiments performed (Color version of this figure is available at Bioinformatics online.)