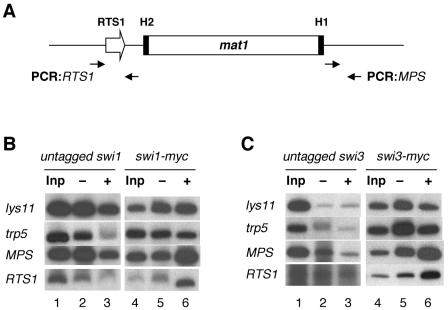
FIG. 6.
Localization of Swi1p and Swi3p to the mat1 locus. (A) A schematic diagram of mat1 and its MPS and RTS1 regions amplified by PCR is shown. Primer sets for PCR (see Materials and Methods) are represented by filled-in arrows and were used to amplify 234-bp and 473-bp fragments of MPS and RTS1, respectively. (B) Chromatin immunoprecipitation analysis. Related SP976 (untagged swi1) and BSP4 (swi1-myc) strains were used to determine the localization of Swi1p-myc to the MPS and RTS1 regions. (C) Chromatin immunoprecipitation analysis of related strains SP982 (untagged swi3) and BSP16 (swi3-myc) was used to determine the localization of Swi3p-myc to the MPS and RTS1 regions. DNA recovered from each chromatin precipitate was analyzed by hot PCR with the indicated primer sets (see panel A) and deoxynucleoside triphosphates, including [α-32p]dCTP. Inp (input) denotes DNA extracted from the total cell extract that was subjected to immunoprecipitation experiments. It was loaded after manyfold dilution; −, mock precipitation without antibody; +, precipitation with anti-c-myc antibody. The lys11 and trp5 primer sets (see Materials and Methods) were used to amplify fragments of 345 bp for lys11 and 370 bp for trp5 for nonspecific DNA binding controls in both panels B and C.

