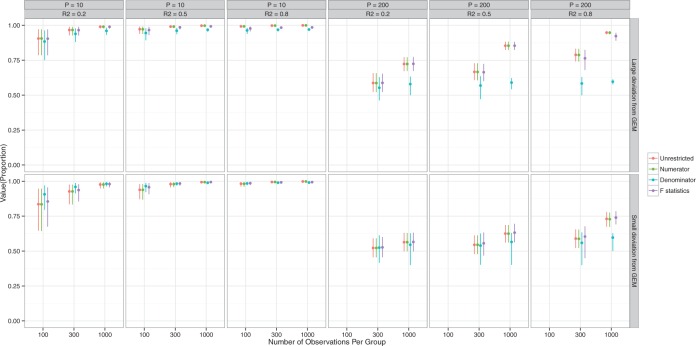
Figure 2.
Non-GEM data generation model. Mean and 95% Monte Carlo (MC) confidence intervals (based on the  MC runs) of the values
  of the decisions, as a proportion
  , for
, for  (left half of panels) and 200 (right half of panels), and for small deviation from GEM (top half of panels) and large deviation from GEM (bottom half of panels). The three panels per (
 , deviation from GEM) combination correspond to
  on the left,
  in the middle and
  on the right. The method based on the unrestricted regression and the three GEM approaches are denoted as: (i) unrestricted—red color, most left; (ii) numerator criteria—green, second from left; (iii) denominator criterion—blue, third from left; (iv)
  criterion—purple, most right. The “Number of observations” on the bottom horizontal axis is the sample size per group.

