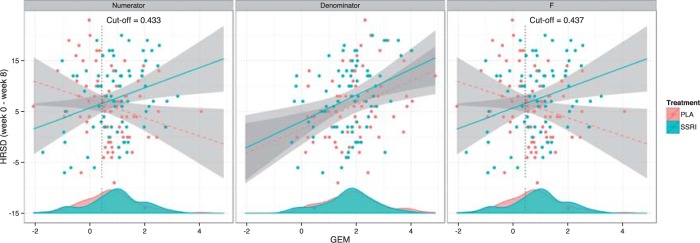
Figure 3.
The relationship between the GEMs obtained from the three criteria and the change in depression (HRSD) from baseline to week 8 for the SSRI (blue) and placebo (red) interventions. The GEMs corresponding to each of the criteria are plotted on the horizontal axis. The lines are the LS lines and the shaded areas indicate the 95% pointwise CIs. The densities of the respective GEMs for the two treatment groups are indicted at the lower part of each panel. The vertical lines indicate the cut-off point on the linear combinations of predictors above which a depressed patient would benefit from treatment with SSRI.

