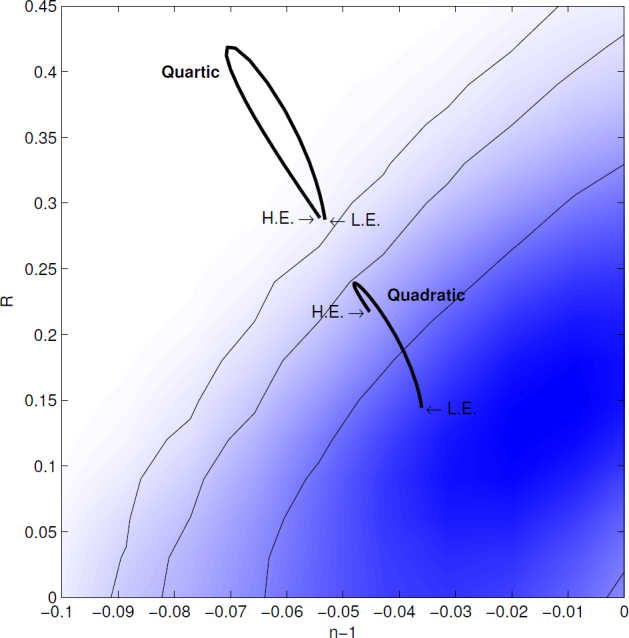
Figure 6.

Constraints from WMAP data on inflation models with quadratic and quartic potentials, where R is the ratio of tensor to scalar amplitudes and n is the scalar spectral index. The high energy (H.E.) and low energy (L.E.) limits are shown, with intermediate energies in between, and the 1-σ and 2-σ contours are also shown. (Figure taken from [203].)
