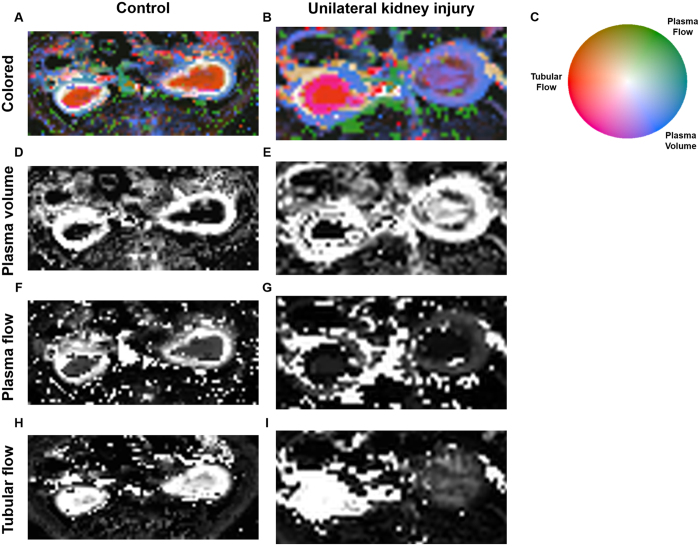
Figure 3. Example of perfusion MRI data sets of rat kidneys.
(A) Control rat kidneys, tri-variate visualization of tubular flow (red), plasma flow (green), plasma volume (blue). It can be seen that both kidneys show a regular stratified pattern with high tubular flow present in the renal medulla and high plasma volume present in the renal cortex. (B) Perfusion MRI after temporary ligature of the left renal artery (on the right-hand side in the image). It can be seen that after kidney injury, the regular pattern is disrupted while it is preserved in the contralateral kidney. These changes are well visualized by a tri-variate color map. (C) Color map.

