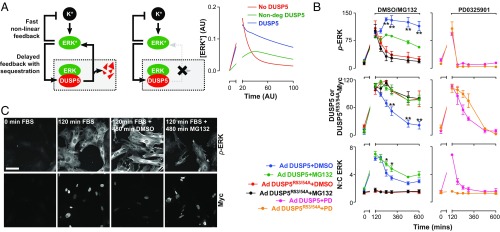
Fig. 5.
DUSP5 degradation controls the amplitude and duration of ERK signaling. (A) The cartoons show a “normal” network structure (Left) and one in which DUSP5 degradation is abrogated (Right). The plot compares model simulations for conditions where DUSP5 is synthesized and degraded (DUSP5), where DUSP5 is absent (No DUSP5) or synthesized but not degraded (Non-deg DUSP5). Comparisons of activated ERK (ERK*) concentrations vs. time are shown in AUs. Note: the break in the x axis is to enable direct comparison with the wet-laboratory data shown in B, in which only prolonged phases (>120 min) of FBS stimulus were measured. (B) Dusp5 KO MEFs were infected with 3 pfu/nL of Ad expressing EGR1 promoter-driven DUSP5-Myc or DUSP5R53/54A-Myc before 20% FBS stimulus for 120 min and treatment with either DMSO vehicle, 10 μM MG132 proteasome inhibitor, or 5 μM PD0325901 MEK inhibitor (PD). Plots show HCM readouts for whole-cell p-ERK, ERK N:C ratio and whole-cell Myc intensity and are shown as normalized population mean AFU ± SEM, n = 3. *P < 0.05, **P < 0.01 using two-way ANOVA and Bonferroni posttest comparing DMSO and MG132-treated cells. (C) Representative images of KO+Ad DUSP5 cells are shown from HCM experiments described in B. (Scale bar: 100 μm.)

