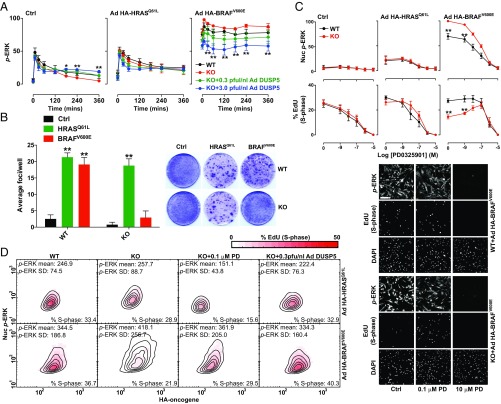
Fig. 6.
BRAFV600E expression combined with Dusp5 deletion causes ERK hyperactivation and proliferative arrest. (A) Primary WT and Dusp5 KO MEFs were infected with empty Ad, Ad HA-HRASQ61L, or Ad HA-BRAFV600E alongside 0.3–3 pfu/nL of Ad expressing EGR1 promoter-driven DUSP5-Myc before stimulation with 20% (vol/vol) FBS. Plots show time courses comparing whole-cell p-ERK levels using HCM. Normalized population mean AFU values are shown ± SEM, n = 4. *P < 0.05, **P < 0.01 comparing KO vs. KO + 3.0 pfu/nL Ad DUSP5-Myc using two-way repeated-measures ANOVA and Bonferroni posttest. (B) Immortalized WT and Dusp5 KO MEFs were infected with retrovirus control, HRASQ61L, or BRAFV600E vectors for 2 wk before assessment of transformed foci using crystal violet staining. Representative plate scans are shown and plots show average focus formation per well ± SEM, n = 4. **P < 0.01 comparing control and oncogene-expressing cells using two-way repeated-measures ANOVA and Bonferroni posttest. (C) Primary WT and Dusp5 KO MEFs were infected with either empty Ad, Ad HA-HRASQ61L, or Ad HA-BRAFV600E and treated with increasing doses of PD0325901 MEK inhibitor for 24 h before a 2-h fluorescent EdU pulse label, immunostaining for p-ERK, and analysis using HCM. Plots show Nuc p-ERK levels and the percentage of EdU-positive cells ± SEM, n = 3. **P < 0.01 using two-way repeated-measures ANOVA and Bonferroni posttest comparing WT and KO. Representative images are shown beneath. (Scale bar: 200 μm.) (D) WT and Dusp5 KO primary MEFs were infected with Ad HA-BRAFV600E (Lower), Ad HA-HRASQ61L (Upper), and 0.3 pfu/nL Ad DUSP5-Myc and treated with 0.1 µM PD0325901 (PD) as indicated for 24 h before 2-h fluorescent EdU pulse-labeling of S-phase cells and counterstaining for p-ERK and HA-tag. The plots show HA intensity vs. Nuc p-ERK in single cells; contour lines show equal cell density; and the heat map reflects the percentage of S-phase–positive cells within HA and p-ERK bins. Data plotted are in raw AFU and population statistics, including mean p-ERK levels, p-ERK SD, and overall percentage of S-phase–positive cells are shown within individual plots.

