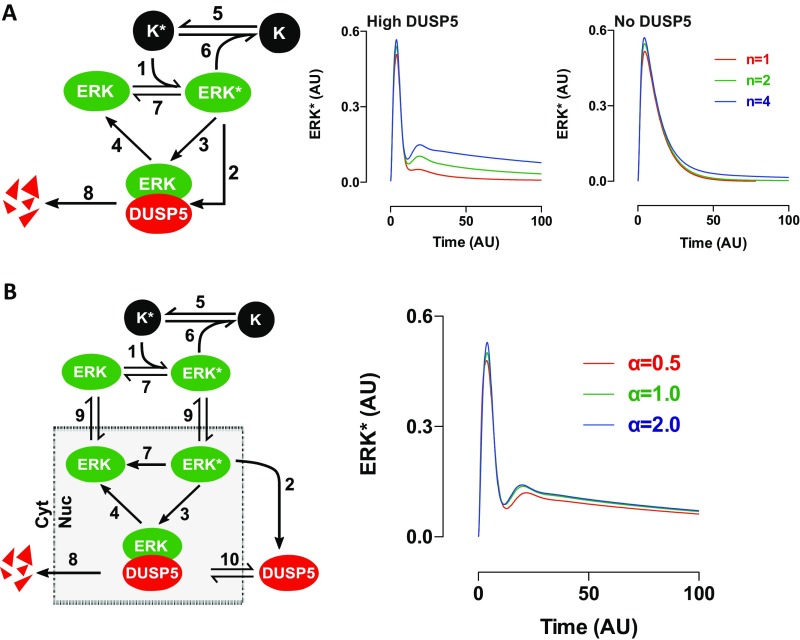
Fig. S5.
The nonlinearity of upstream negative feedback, but not ERK nuclear shuttling, determines the regulatory effects of DUSP5 in silico. (A) A network topology scheme (Left) represents a minimal interaction network comprising K (an upstream activator of ERK), ERK, and DUSP5. K* and ERK* represent activated versions of K and ERK, respectively. A full description of equations and a table describing reactions numbered as presented in the network scheme is included in SI Materials and Methods. The only reaction that is not modeled using mass action kinetics is the negative feedback between ERK* and K*, which is modeled using a Hill function (reaction no. 6 in Table S1). (Right) Plots show ERK* output kinetics under conditions in which different values of Hill coefficient (which alter cooperativity described in the Hill function) were used to model the feedback between ERK* and K* (n = 1, 2, or 4) in the presence of high levels of DUSP5 synthesis (High DUSP5) or no DUSP5 synthesis (No DUSP5). The plots only replicate our biological data, where high levels of DUSP5 cause a rebound in ERK signaling (Figs. 1 and 4), when the level of cooperativity between ERK* and K* is also high (Hill coefficient, n = 4). (B) An expanded network topology scheme is shown (Left), incorporating nuclear shuttling of ERK as well as cytoplasmic synthesis and nuclear import of DUSP5. Plots of ERK* output from model simulations in the compartmentalized model are shown (Right), in which DUSP5 synthesis levels were varied, and ERK nuclear shuttling rates (α in reaction no. 9, Table S2) were set at 0.5, 1.0, or 2.0 events per arbitrary unit of time. These estimates of shuttling rate (relative to the time course of DUSP5 effects) are consistent with published studies showing that rates of active and inactive ERK nuclear shuttling are very rapid (57). The rate of ERK nuclear shuttling in our model failed to appreciably influence the effects of DUSP5 on ERK* signal propagation even when varied to these extents. Because nuclear shuttling is unlikely to influence predictions on these much longer timescales, we therefore decided to use the simplified, reduced model in Fig. S5A in all further predictive simulations.

