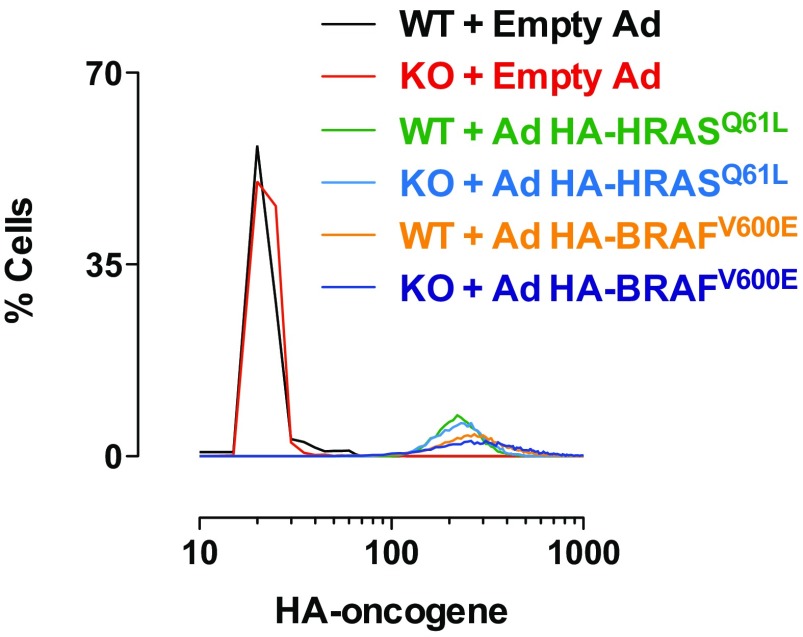
Fig. S6.
Single-cell expression ranges of adenovirus-delivered HA-tagged oncogenes in MEFs. Primary WT and Dusp5 KO MEFs were infected with 3 pfu/nL empty Ad, Ad HA-HRASQ61L, or Ad HA-BRAFV600E for 24 h. Cells were stained for HA-tag before HCM. Four fields per well per fluorophore were acquired from cells. Frequency histograms of whole-cell HA-oncogene stain intensity using raw AFU values per cell from a representative experiment from n = 4 are shown.

