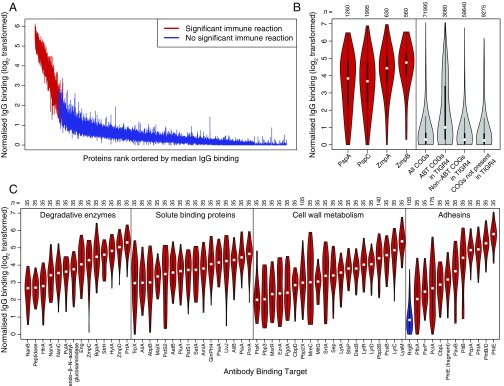
Fig. 1.
Binding of IgG to 2,190 representatives of the pneumococcal pangenome. (A) Distribution of IgG binding responses on a logarithmic scale. A vertical line shows the interquartile range of IgG binding measurements across the 35 serum samples for each protein on the microarray. The proteins are ordered by the rank of the median IgG binding level across sera, with lines for proteins classified as ABTs colored red and those for non-ABTs blue. (B) Validation of IgG binding results. The left four violin plots show the IgG binding elicited across the 35 serum samples by the 36 PspA variants, 57 PspC variants, 18 ZmpA variants, and 16 ZmpB variants. Each violin plot is annotated with the number of datapoints in the distribution. The right four violin plots show, from left to right, the overall IgG binding elicited by the 2,057 proteins selected as representatives of the COGs previously defined using a population of pneumococci from Massachusetts, the IgG binding elicited by the 88 COGs that matched antigens identified in S. pneumoniae TIGR4 using antibody fingerprinting, the IgG binding elicited by the 1,704 COGs matching S. pneumoniae TIGR4 proteins that failed to trigger adaptive immune responses detectable by antibody fingerprinting, and the IgG binding elicited by the 265 COGs that were not orthologous with proteins in S. pneumoniae TIGR4. (C) Red violin plots showing the IgG binding to selected ABTs grouped by function and ordered by median IgG binding level. RrgB, not classed as an ABT in this analysis, is displayed for comparison as a blue violin plot.

