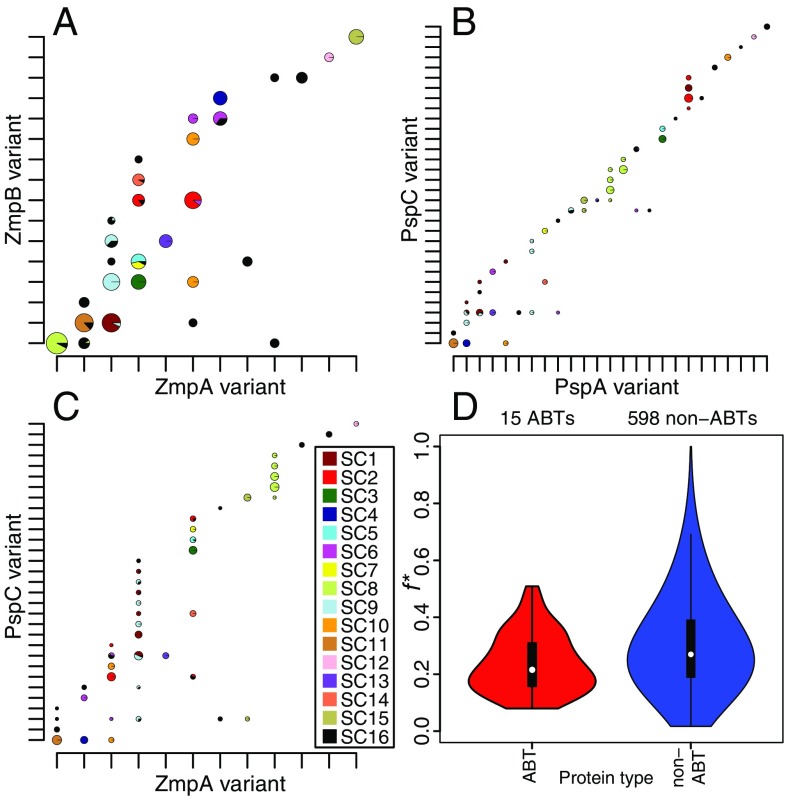
Fig. 6.
Cooccurrence of variants of pneumococcal CDSs. (A) Cooccurrence of ZmpA and ZmpB variants. The variants were ordered on the axes to maximize the number of combinations on the “diagonal” of the plot. Observed variant combinations are marked with pie charts, which illustrate the genetic backgrounds in which they were found as segments colored according to the sequence clusters to which the relevant isolates belong (key in C and annotated phylogeny in Fig. 4). The diameter of the pie charts is proportional to the logarithm of the number of isolates with the relevant antigenic profile; only combinations found in >0.5% of the population are shown. Note that the diameters of the pie charts are not directly comparable between panels. (B) Cooccurrence of PspA and PspC variants in the population, displayed as described in A. (C) Cooccurrence of ZmpA and PspC variants in the population, displayed as described in A. (D) Violin plots displaying the f* values for all pairwise comparisons between variable core ABT COGs alongside those for all pairwise comparisons between variable core non-ABT COGs. Only COGs for which at least two variants were defined, with at least two variant combinations both present in the population at greater than 5% frequency, were included in this comparison.

