Fig. 3.
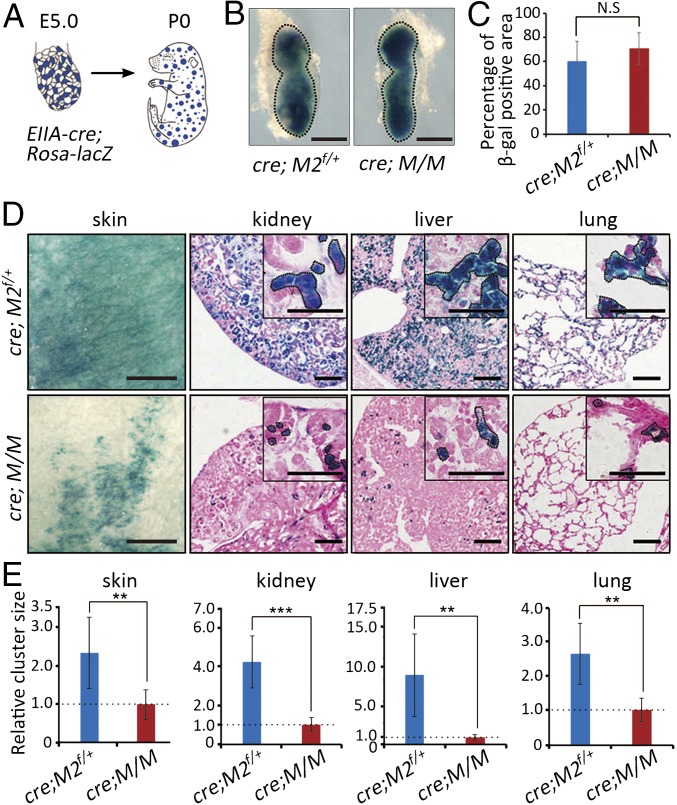
Cells with the Mdm2+/−Mdm4+/− genotype were outcompeted in EIIA-cre-induced mosaic embryos. (A) A schematic presentation of the mosaic mice. (B) Whole-mount X-Gal staining of E6.5 EIIA-cre; Rosa-lacZ; Mdm2flox/+ (M2f/+) and EIIA-cre; Rosa-lacZ; M/M embryos. Embryonic tissues were marked by dotted lines. (Scale bars, 1 mm.) (C) Percentages of β-gal-expressing cells in E6.5 EIIA-cre; Rosa-lacZ; Mdm2flox/+ (M2f/+) and EIIA-cre; Rosa-lacZ; M/M embryos (n = 6). Data are presented as mean ± SD. Statistical significance was determined by Student’s two-tailed t test. N.S., not significant. (D) X-Gal staining of tissues from neonatal EIIA-cre; Rosa-lacZ; Mdm2flox/+ (M2f/+) and EIIA-cre; Rosa-lacZ; M/M mice. Insets indicated higher magnification. Areas marked with dotted lines indicated cell clusters. (Scale bars, 100 μm.) (E) Quantifications of the size of cell clusters in skin, kidney, liver, and lung of EIIA-cre; Rosa-lacZ; M/M and EIIA-cre; Rosa-lacZ; Mdm2flox/+ (M2f/+) mice (n = 4). Data are presented as mean ± SD. **P ≤ 0.01; ***P ≤ 0.001 (two-tailed t test).

