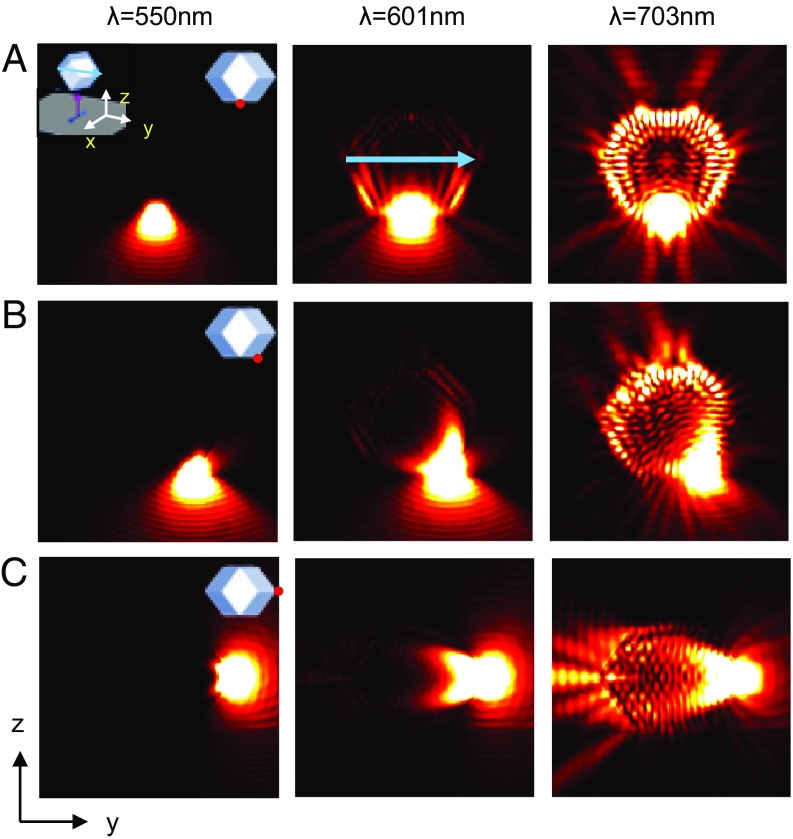
Fig. 3.
Simulated microcavity near-field emission profiles. (A) FDTD-simulated near-field emission profile () of a dipole at the bottom of a superlattice microcavity. The microcavity center is (x,y,z) = (0,0,0), L is 5 µm, and the gold FF is 6%. (Left Inset) Microcavity orientation with respect to the coordinates as in Fig. 1. The incident direction of the excitation laser is indicated by a red arrow below the RD geometry. (Right Inset) Dipole (red dot) location, in the y–z plane, at the bottom of the RD geometry right beneath the facet. is indicated by a blue arrow. Three dipole orientations aligned with the x, y, and z axes were used and were averaged incoherently over these orientations. Three wavelengths are presented to show the behaviors close to and away from the LSPR frequency. Intensity around each dipole was purposely saturated based on the same scaling scheme to show light scattering throughout the RD shape. A substrate (n = 1.44) was added below the RD shape. (B and C) The same type of data as in A for two other dipole locations. All of the dipole sources were in the y–z plane beneath the surface of the RD shapes. Fig. S6 for emission profiles in the x–z plane.

