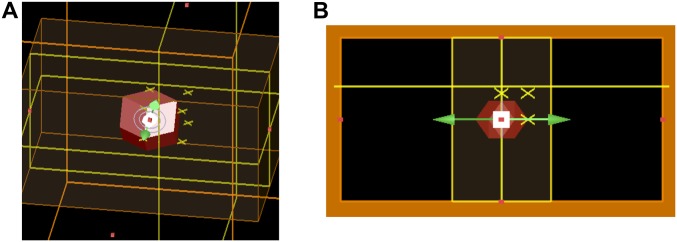
Fig. S5.
(A) Three-dimensional CAD image showing an FDTD setup with a dipole light source used to analyze dye emission scattering through the RD geometry. The arrow indicates the location and the orientation of a dipole source placed in the RD geometry. To calculate the near-field intensity, three 2D monitors (yellow) are placed parallel with and perpendicular to the optical axis in the experiment. A glass substrate is also inserted when necessary. (B) A 2D top view of the 3D image in A. The vertical direction corresponds to the optical axis of the microscope used in the experiment.

