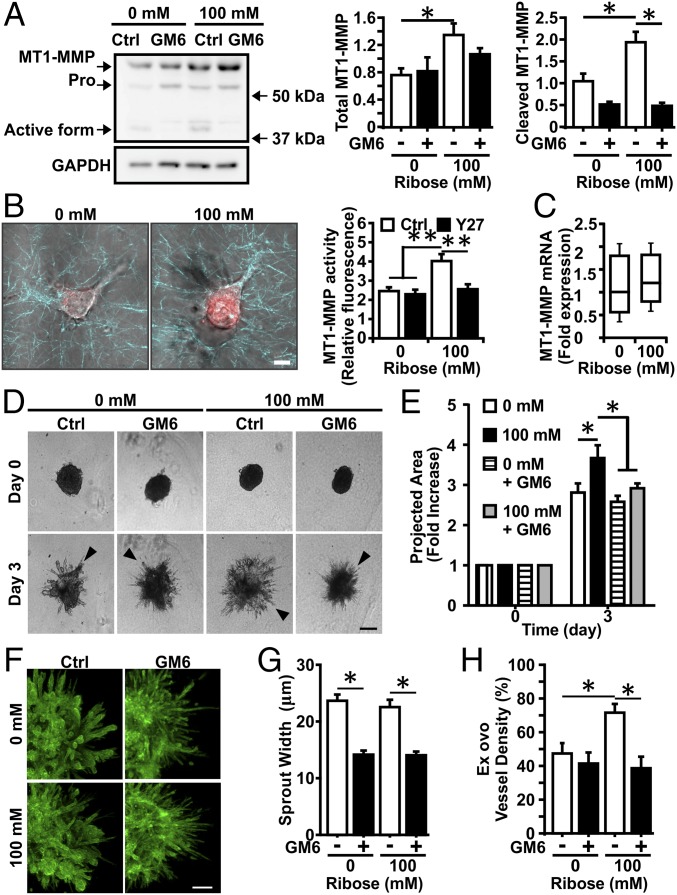
Fig. 4.
Stiffness-mediated angiogenic outgrowth requires MMP activity. (A, Left) Western blot for MT1-MMP in ECs embedded within 1.5-mg/mL collagen gels glycated with 0 or 100 mM ribose and fed with complete medium with (GM6) or without (Ctrl) 5 μM GM6001. (Right) The corresponding densitometric quantification normalized to actin content. GAPDH was used as loading control. (B, Left) Confocal images showing MT1-MMP activity in ECs embedded within 1.5-mg/mL collagen gels glycated with 0 or 100 mM ribose. (Right) The corresponding quantification with (Y27) or without (Ctrl) 10 μM of the ROCK inhibitor Y27632. (Scale bar, 10 μm.) (C) MT1-MMP expression determined by quantitative real-time RT-PCR does not show expression differences as a function of increased stiffness. (D) EC multicellular spheroids were embedded within 1.5-mg/mL collagen gels glycated with 0 or 100 mM ribose and fed with complete medium with (GM6) or without (Ctrl) 5 μM GM6001. (Scale bar, 200 μm.) (E) Spheroid outgrowth was quantified after 3 d of culture and normalized to the day 0 condition. (F) Spheroids were stained for actin (green) and nuclei (blue) and were imaged with confocal microscopy. (Scale bar, 100 μm.) (G) The width of angiogenic sprouts was measured by fitting the intensity profile of a line drawn perpendicular to the sprout with a two-Gaussian curve. (H) Quantification of vessel density into 1.5-mg/mL collagen gels glycated with 0 or 100 mM ribose during the CAM angiogenic sprouting assay with or without 5 μM GM6001. Data are presented as mean + SEM; *P < 0.05.

