Fig. 5.
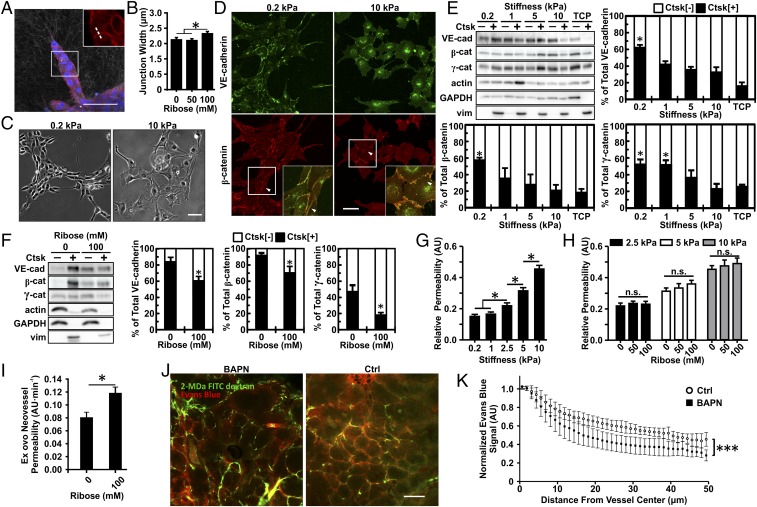
Matrix stiffness alters VE-cadherin expression, junction width, and endothelial cell permeability. (A) EC spheroids were fixed 24 h after embedding within 1.5-mg/mL collagen gels glycated with 0, 50, or 100 mM ribose and were imaged with confocal microscopy to visualize VE-cadherin (red) and nuclei (blue) with confocal reflectance of the collagen fibers. The zoomed-in insert shows a representative region used to obtain the VE-cadherin junction width profiles from a line perpendicular to the junction (dotted line). (B) Corresponding quantification of the width of junctions between stalk cells of the sprouts. (C and D) Phase-contrast images showing ECs seeded on compliant (0.2 kPa) or stiff (10 kPa) PA substrates (C) along with the corresponding VE-cadherin and β-catenin localization at cell–cell junctions (arrowheads) showing a continuous distribution on compliant matrix and a punctate distribution on stiff matrix (D). Insets are magnifications of boxed regions. (E and F) Western blot and corresponding quantification of VE-cadherin, β-catenin, and γ-catenin content in the soluble fraction (Ctsk[−]) versus the cytoskeleton-associated insoluble fraction (Ctsk[+]) for ECs seeded on PA 2D substrate (E) or ECs embedded within 1.5-mg/mL collagen gels glycated with 0 or 100 mM ribose (F). Vimentin was used as the insoluble Ctsk[+] fraction control. TCP, tissue culture plastic. (G and H) Quantification of the EC monolayer permeability to 40-kDa FITC-dextran in response to matrix stiffness (G) and collagen glycation (H). (I) Quantification of the neovessel permeability in the CAM angiogenic sprouting assay in 1.5-mg/mL collagen gels glycated with 0 or 100 mM ribose. (J) Representative confocal images from MMTV-PyMT mice treated with BAPN or vehicle controls (Ctrl) showing 2-MDa FITC-dextran–labeled vasculature (green) and extravasating Evans blue (red). (K) Quantification of vessel permeability to Evans blue with BAPN or vehicle controls (Ctrl). (Scale bars, 50 μm.) Data are presented as mean ± SEM; *P < 0.05, ***P < 0.0001.

