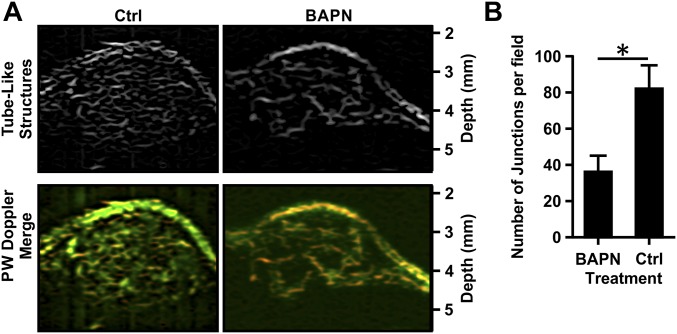
Fig. S3.
Vasculature quantification using ImageJ skeletonization. (A) To quantify the tumor vasculature, ultrasound images obtained in the power wave (PW) Doppler mode (shown in the merged overlay) were processed using the ImageJ Tubeness plugin to obtain the tube-like structures for MMTV-PyMT mice treated with BAPN or vehicle (Ctrl). (B) Corresponding quantification of the number of junctional nodes, including the starting and ending nodes of each branch network, present within the vascular network within the field of view. Data are presented as mean + SEM; *P < 0.05.

