Fig. S6.
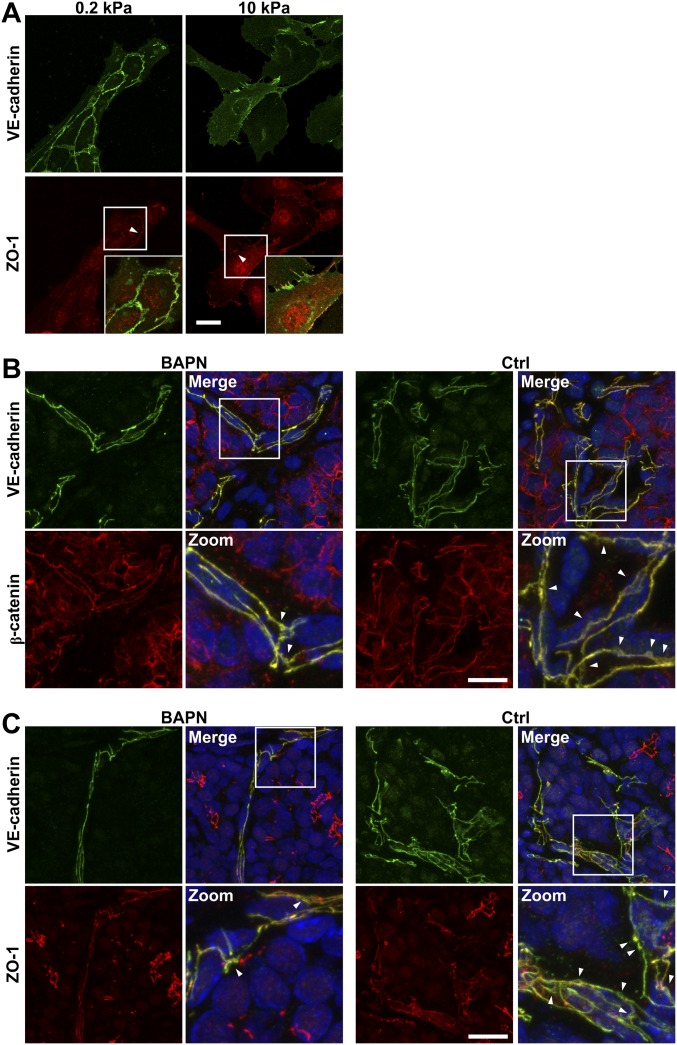
Matrix stiffness alters cell–cell junction organization. (A) Confocal images showing ECs seeded on compliant (0.2 kPa) or stiff (10 kPa) PA substrates stained for VE-cadherin and ZO-1 showing a continuous distribution on compliant matrix and a punctate distribution on stiff matrix. Insets are magnifications of the boxed regions. (Scale bars, 50 μm.) (B and C) Confocal images from MMTV-PyMT mice treated with BAPN or vehicle controls (Ctrl) showing increased diffuse staining (arrowheads) of VE-cadherin, β-catenin, and ZO-1 in stiffer tumor. Zoomed images are magnifications of the boxed regions. (Scale bars, 20 μm.)

