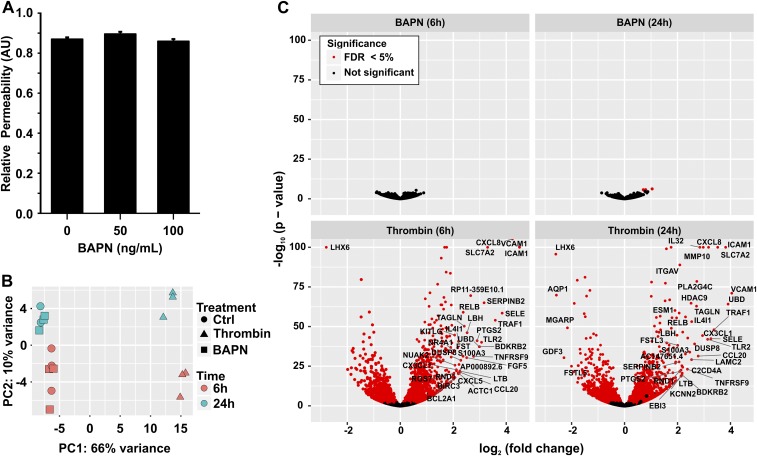
Fig. S8.
BAPN does not influence ECs in vitro. (A) Quantification of the permeability of the EC monolayer to 40-kDa FITC-dextran in the presence of 50- or 100-ng/mL BAPN. (B) 2D PCA plot of RNA-seq data indicate the clustering of gene-expression profiles arising from HUVEC cells treated with vehicle (Ctrl; circles), thrombin (4 U/mL) as positive control (triangles), or BAPN (100 ng/mL; squares) at 6 h (green) or 24 h (red). PC1 (the horizontal axis) is dominated by the treatment and accounts for 66% of variance. PC2 (the vertical axis) is dominated by the time point and accounts for 10% of variance. (C) Volcano plot indicating statistically significant changes in gene expression for BAPN at 6 h and 24 h (Upper) and thrombin at 6 h and 24 h (Lower). The horizontal axis indicates the log2-fold change for each treatment. The vertical axis indicates the −1 × log10 of the P value. Significant changes are indicated by red points (FDR <5%). Points for genes demonstrating a greater than fourfold increase or decrease in expression upon treatment are further labeled with their gene symbol.

