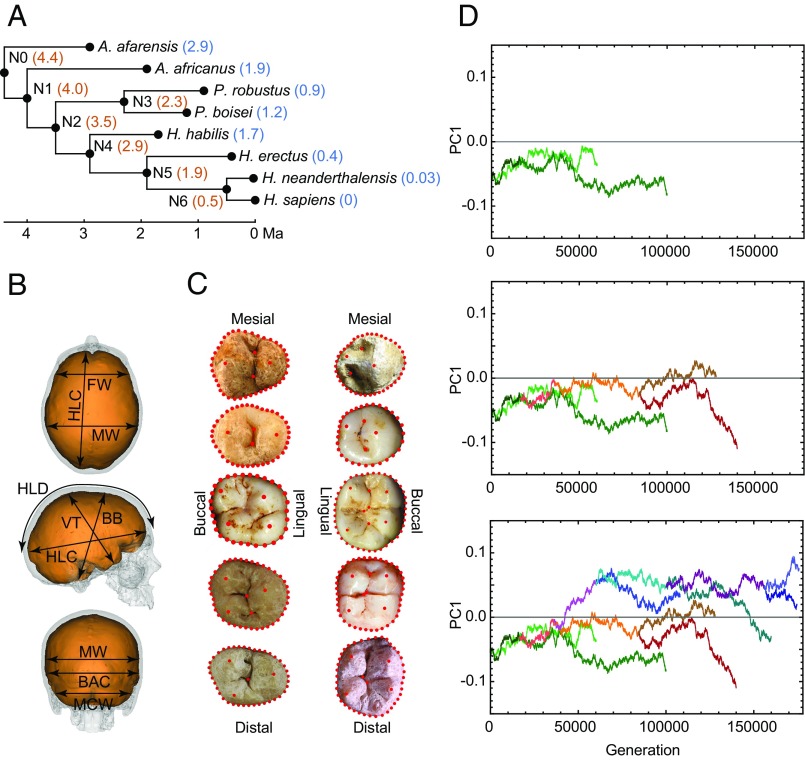
Fig. 1.
Methodological setup of the study. (A) The hominin phylogeny used in our analyses indicating the dates used for terminal species (blue) and nodes (orange). (B) Linear metrics used in the study of endocranial variation. FW, frontal width at Broca's cap; HLC, hemispheric length chord; MW, maximum endocranial width; HLD, hemispheric length dorsal arch; BB, basion–bregma distance; VT, vertex-lowest temporal distance; BAC, biasterionic chord; MCW, maximum cerebellar width. (C) Landmark and semi-landmark datasets used in the study of postcanine dental variation. Upper teeth are on the left, and lower teeth are on the right. Postcanine teeth are represented from top to bottom following the sequence P3, P4, M1, M2, and M3. (D) BM simulation of the evolution of one trait (PC1 score) across the hominin phylogeny. (Top) Green traces show evolution along the A. afarensis and A. africanus branches. (Middle) Simulated evolution along the Paranthropus clade (orange and red traces) is added to the above plot. (Bottom) Simulated evolution along the Homo clade (blue and purple traces) is added to the above graphs.

