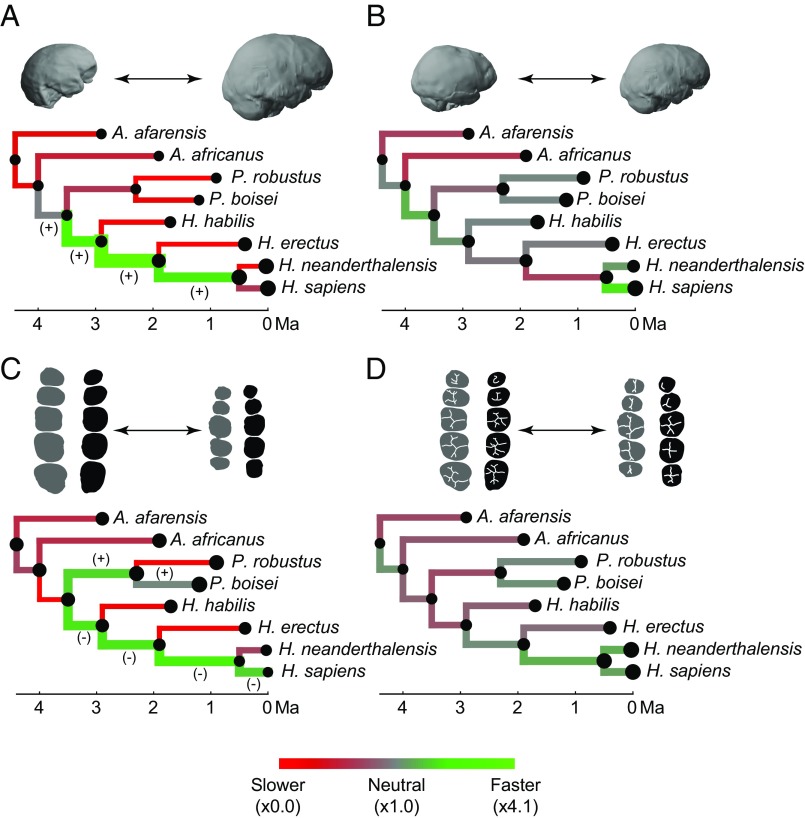
Fig. 3.
Evolution of endocranial and dental size and shape. (A) Comparison of observed and simulated branch-specific amounts of endocranial size variation. (B) Comparison of observed and simulated amounts of endocranial shape variation. (C) Comparison of observed and simulated amounts of dental size variation. (D) Comparison of observed and simulated amounts of dental shape variation. Red represents stasis along a given branch, and green represents fast evolution along a given branch, regardless of the directionality of change. Branch thickness is proportional to the observed amount of change along a given branch. In A and C, the plus sign represents size increase, the minus sign represents size decrease along fast-evolving branches, and tip and node size are proportional to endocranial and dental size. In B and D the amount of change per branch is based on shape distances that include all dimensions of the morphospace, and node and tip size are proportional to the amount of shape change with respect to the ancestral-most node. The specimen examples are the same as in Fig. 2. Orientation of endocasts and teeth is the same as in Figs. 1 and 2.

