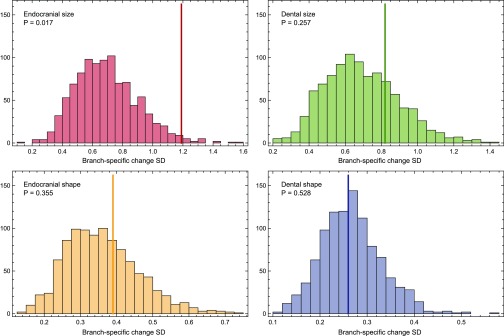
Fig. S1.
Comparison of observed and simulated results. Histograms show the distributions of standard deviations (SDs) of the branch-specific amounts of evolutionary change across the hominin phylogeny obtained in 1,000 constant-rate simulations. P values are calculated as the proportion of constant-rate simulations yielding a higher SD than the observed SD for each trait (solid vertical lines).

