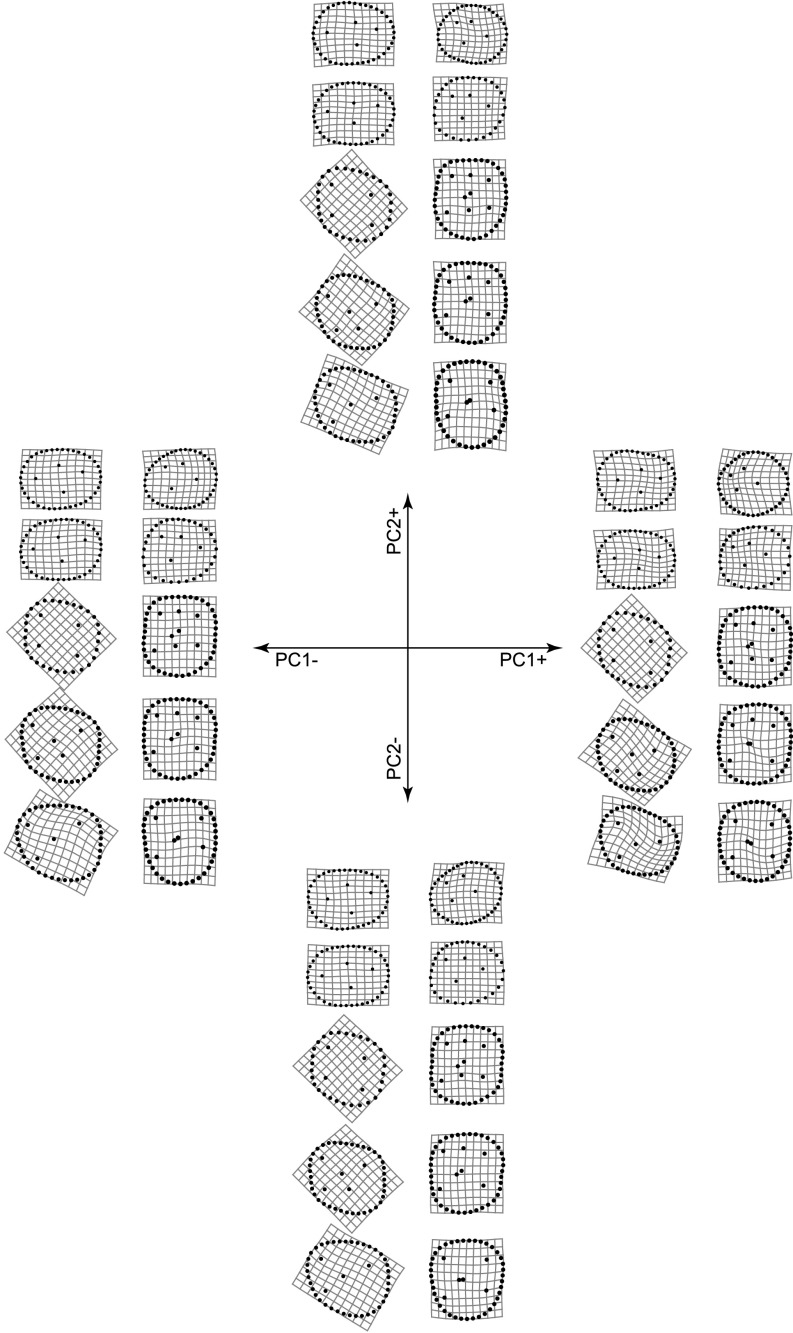
Fig. S4.
Thin plate spline (TPS) grids showing the most extreme patterns of tooth shape variation along PC1 and PC2. Represented grids are those corresponding to the most extreme PC scores in our dataset. The position and orientation of the TPS grids are the same as those of the teeth in Fig. 1.

