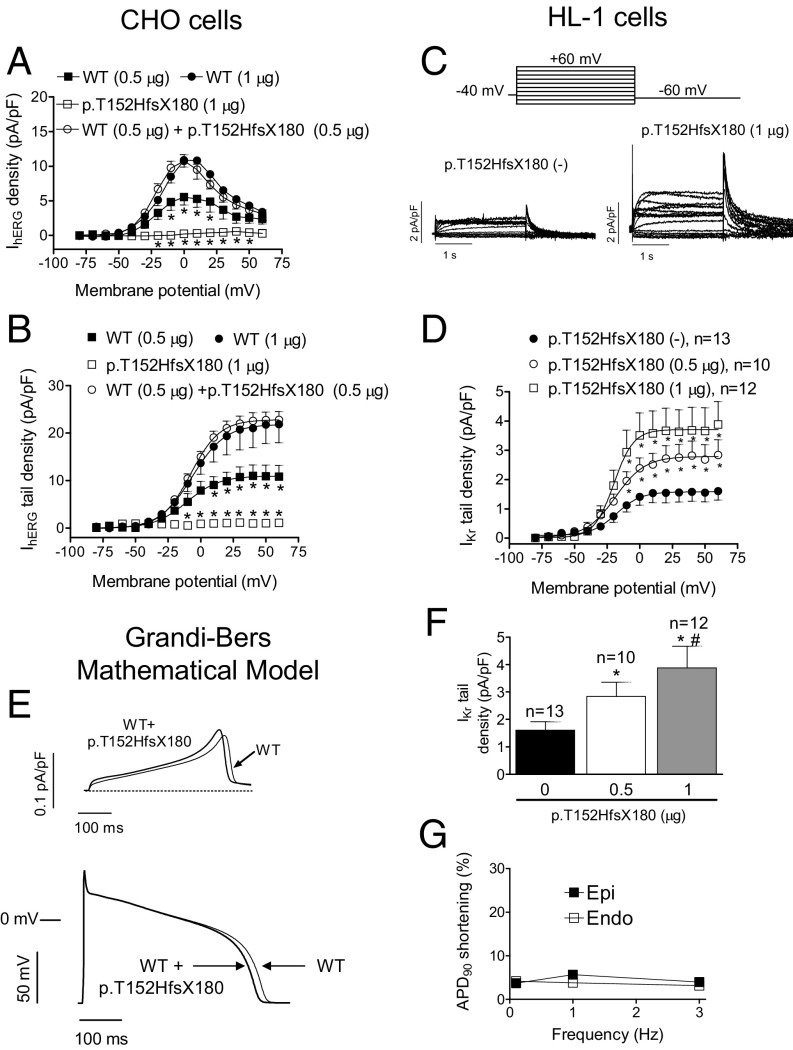
Fig. 2.
(A and B) Maximum current density (current density–voltage relationships) (A) and tail currents (activation curves) (B) generated by WT and p.T152HfsX180 hERG channels alone or when they are cotransfected in CHO cells, as a function of the membrane potential. In B, solid lines represent the fit of a Boltzmann equation. *P < 0.05 vs. hERG WT (1 µg) (n ≥ 6). (C) IKr traces recorded in IKr-predominant HL-1 cells transfected or not with p.T152HfsX180 hERG. (D) IKr tail current densities recorded in HL-1 cells transfected or not with p.T152HfsX180 hERG. (E) Simulated IKr traces (Top) and APs (Bottom) obtained at 0.1 Hz by using the Grandi–Bers mathematical model of human ventricular endocardial cells by introducing the modifications produced by p.T152HfsX180 hERG on the IKr. (F) IKr tail current densities recorded in HL-1 cells transfected or not with p.T152HfsX180 hERG after pulses to +60 mV. (G) Percentage of APD90 shortening in APs simulated at different frequencies in epicardial and endocardial cells. Points/bars represent mean ± SEM of the data. In D and F, n, number of cells; *P < 0.05 vs. nontransfected cells; #P < 0.05 vs. p.T152HfsX180 0.5 μg transfected cells.

