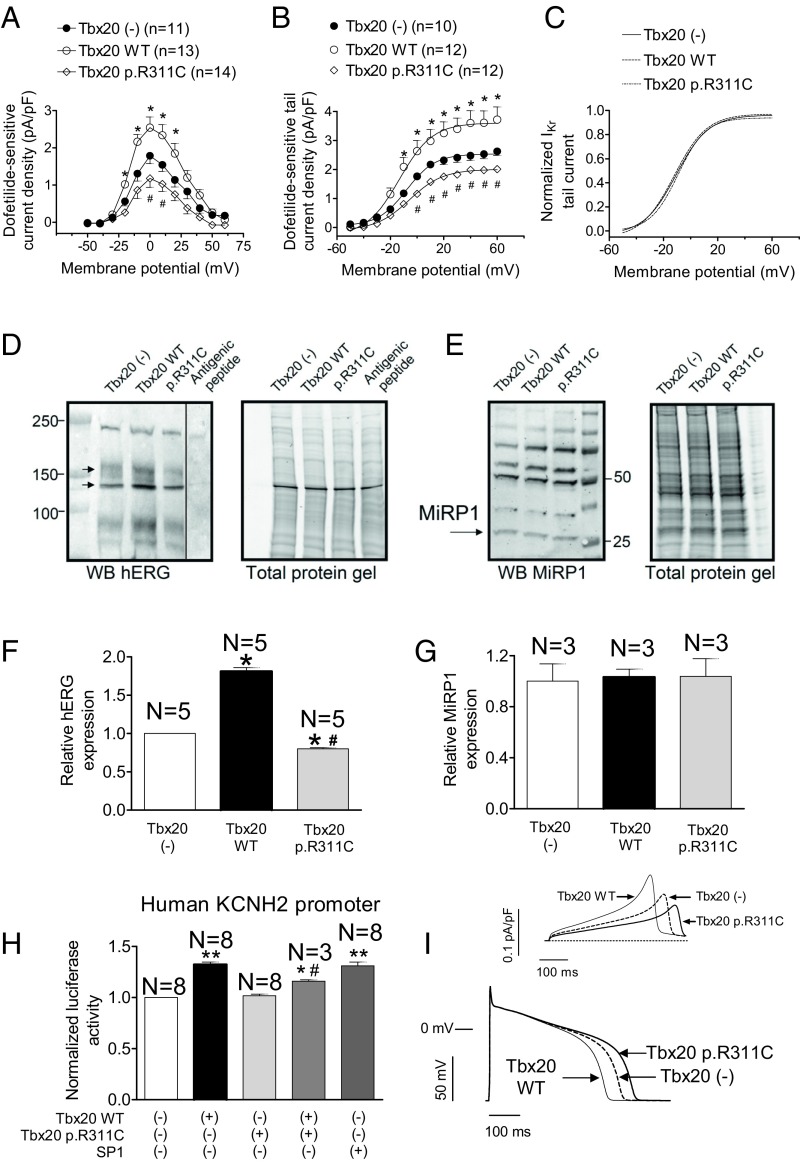
Fig. 4.
(A and B) Maximum IKr density–voltage relationships (A) and activation curves (B) for currents recorded in IKr-predominant and -intermediate HL-1 cells transfected or not with either WT or p.R311C Tbx20. (C) Normalized activation curves for currents recorded in the three experimental groups. In B and C, solid lines represent the fit of a Boltzmann equation. (D and E) Western blot (WB) images and their corresponding stain-free gels showing hERG (arrows in D) and miRP1 (E) expression in HL-1 cells transfected or not with either WT or p.R311C Tbx20. In D, the sample of the last right lane was run in the same gel but was separated (continuous line) when incubating with the primary antibody together with the antigenic peptide. (F and G) Mean densitometric analysis of hERG (F) and MiRP1 (G) levels normalized to total protein. (H) Normalized luciferase activity in HL-1 cells expressing the pLightSwitch_Prom vector carrying the human KCNH2 promoter cotransfected or not with SP1 and either WT or p.R311C Tbx20. (I) Simulated IKr traces (Top) and APs (Bottom) obtained at 0.1 Hz by using the Grandi–Bers mathematical model of human ventricular endocardial cells by introducing the modifications produced by Tbx20 WT and p.R311C on the IKr. Points/bars represent mean ± SEM of the data. n, number of cells; N, number of dishes. *P < 0.05 vs. Tbx20 (-); #P < 0.05 vs. Tbx20 WT; **P < 0.01 vs. Tbx20 (-).

