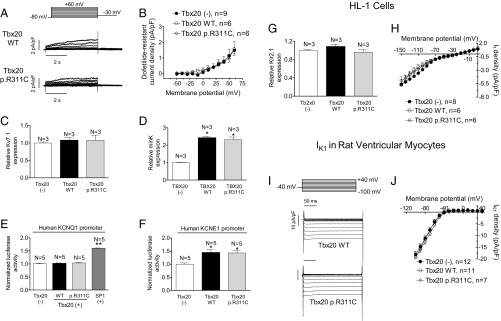
Fig. 6.
(A) Traces of dofetilide-resistant current (IKs) recorded in IKs-predominant HL-1 cells transfected with WT or p.R311C Tbx20 by applying the pulse protocol (Top). (B) Current density–voltage relationships for IKs recorded in HL-1 cells transfected or not with WT or p.R311C Tbx20. (C and D) Mean densitometric analysis of Kv7.1 (C) and minK (D) levels normalized to total protein. (E and F) Normalized luciferase activity in HL-1 cells expressing the pLightSwitch_Prom vector carrying the human KCNQ1 (E) or KCNE1 (F) promoters cotransfected or not with WT or p.R311C Tbx20. (G) Mean densitometric analysis of Kir2.1 levels normalized to total protein. (H) Current density–voltage relationships for If recorded in HL-1 cells transfected or not with WT or p.R311C Tbx20. (I) IK1 traces recorded in two rat myocytes infected with WT and p.R311C Tbx20. (J) Mean current density–voltage curves for IK1 recorded in rat ventricular myocytes infected or not with lentiviral constructs encoding WT and p.R311C Tbx20. Each point/bar represents mean ± SEM of n cells or N dishes of cells in each group. *P < 0.05 vs. Tbx20 (-); **P < 0.01 vs. Tbx20 (-).

