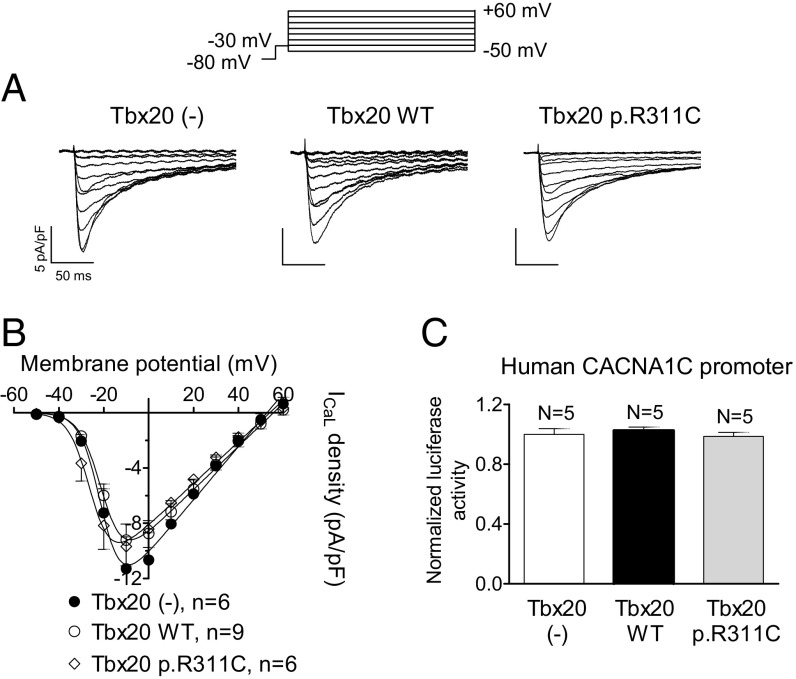
Fig. 8.
(A) ICaL traces recorded in hiPSC-CMs infected or not with WT or p.R311C Tbx20 by applying the pulse protocol (Top). (B) Current density-voltage relationships for ICaL recorded in the three experimental groups. (C) Normalized luciferase activity in HL-1 cells expressing the pLightSwitch_Prom vector carrying the human CACNA1C promoter cotransfected or not with WT or p.R311C Tbx20. Each point/bar represents the mean ± SEM of n cells or N dishes of cells in each group.

