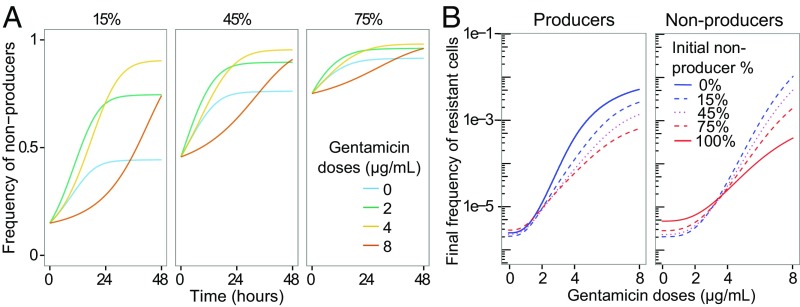
Fig. 3.
Results of the mathematical model fitted to the experimental data. (A) Change in nonproducer frequencies in a mathematical model between T0 and T48. Panels correspond to different initial frequencies of nonproducers. Colors represent gentamicin doses. (B) Resistance frequencies in a mathematical model at T48. Final frequency of resistant cells in producers (Left) and nonproducers (Right) in monocultures (solid lines) and in mixed cultures (dashed lines) for different doses of gentamicin. SI Appendix provides model definition and parameter values.

