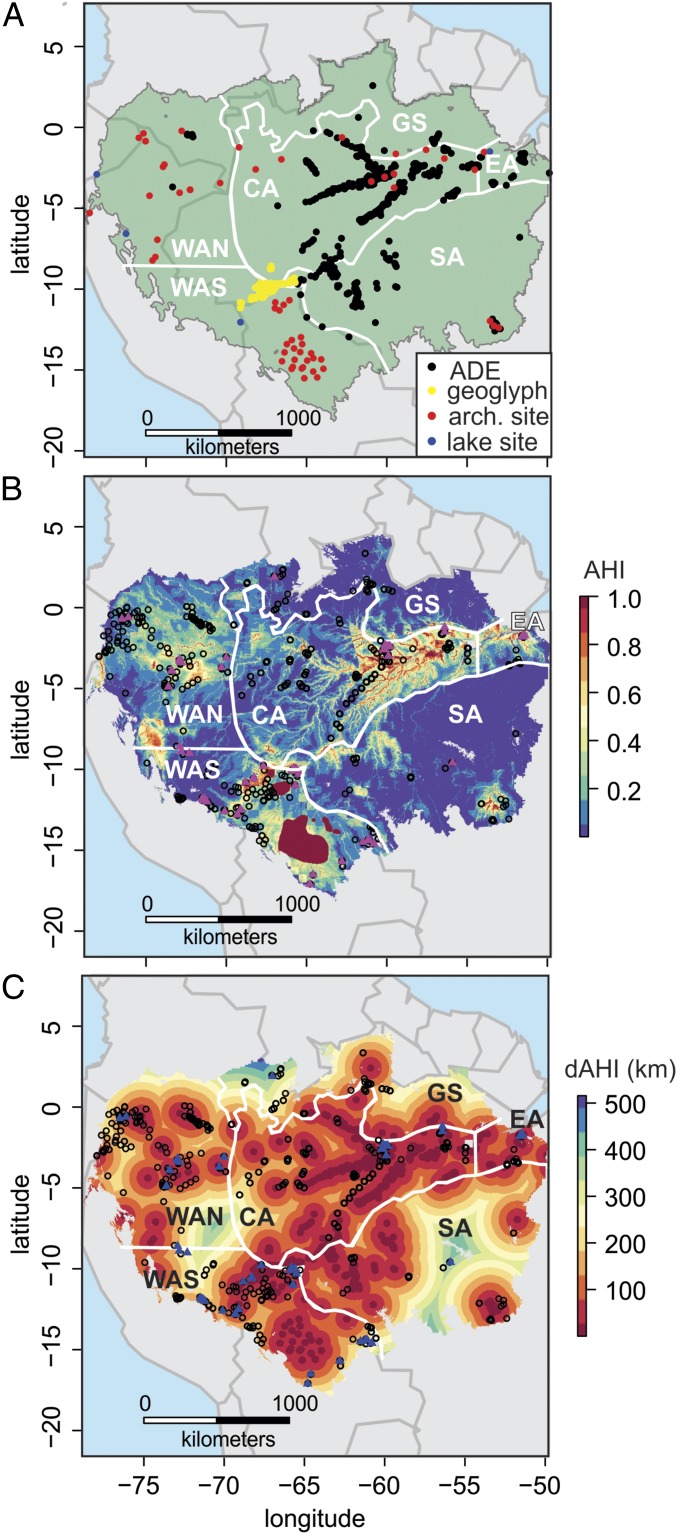
Fig. 1.
Amazonia sensu stricto and regional divisions (sensu 5) shown with locations containing AHIs used to create the AHI models and dAHI raster (A), modern forest inventory and recensus plot locations overlain on AHI model output (B), and modern forest inventory and recensus plot locations overlain on the dAHI raster (C). Black circles in B and C represent single-census plot locations. Pink triangles in B and dark-blue triangles in C represent recensus plot locations from Johnson et al. (53). Regional divisions of Amazonia are shown with white lines and are labeled with white text (CA, central; EA, eastern; GS, Guiana Shield; SA, southern; WAN, northwestern; WAS, southwestern) (5). In B, the large dark-red polygon in WAS represents the Llanos de Moxos in Bolivia, which has extensive ancient earthworks and landscape transformations (28, 68).

