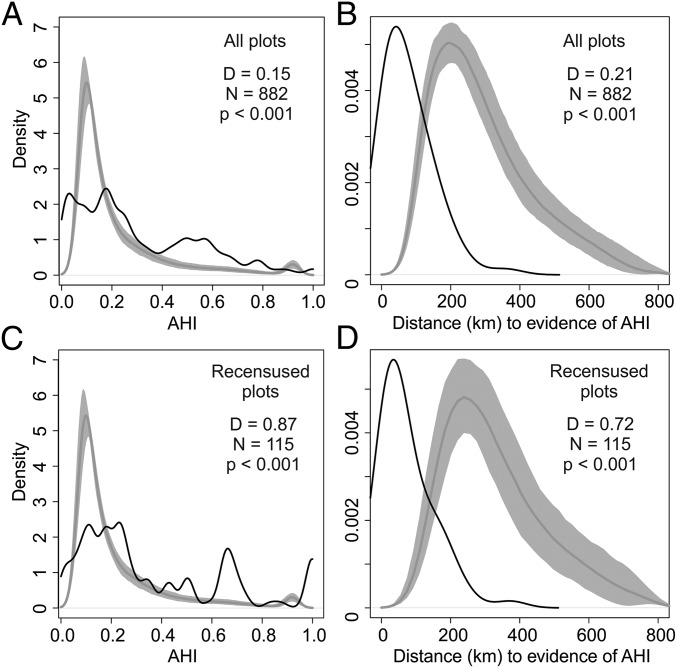
Fig. 2.
Density of AHI probabilities for the 882 forest inventory plots (A and B) and a subset of 115 recensused plots (C and D), in Amazonia (black line) compared with density values generated from 500 simulations of random points across Amazonia (gray line and shading). The dark-gray line represents the median of the simulated densities, and the light-gray shading represents the upper and lower 95% confidence intervals. Bandwidths for density functions were 0.025 for AHI densities (A and C), and 45 for dAHI densities (B and D).

