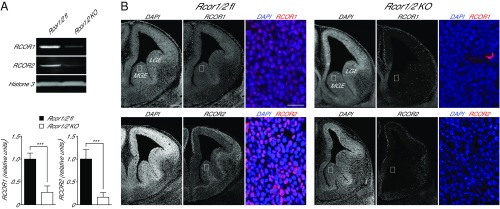
Fig. 1.
Analysis of RCOR1 and RCOR2 expression at E13.5 in the Rcor1/2 fl and Rcor1/2 knockout mice. (A) Western blot analysis. RCOR1 and RCOR2 levels were normalized to histone H3 levels. The means and SDs are indicated. Statistical significance was assessed by t test (n = 4 mice). ***P < 0.001. (B) Representative immunohistochemistry on coronal hemisections of control (Rcor1/2 fl) and Rcor1/2 KO telencephalon labeled with the indicated antibodies and DAPI to mark nuclei. Boxes indicate regions shown at higher magnification to the right. (Scale bars, 200 μm and 20 μm.) LGE, lateral ganglionic eminence; MGE, medial ganglionic eminence.

