Fig. 4.
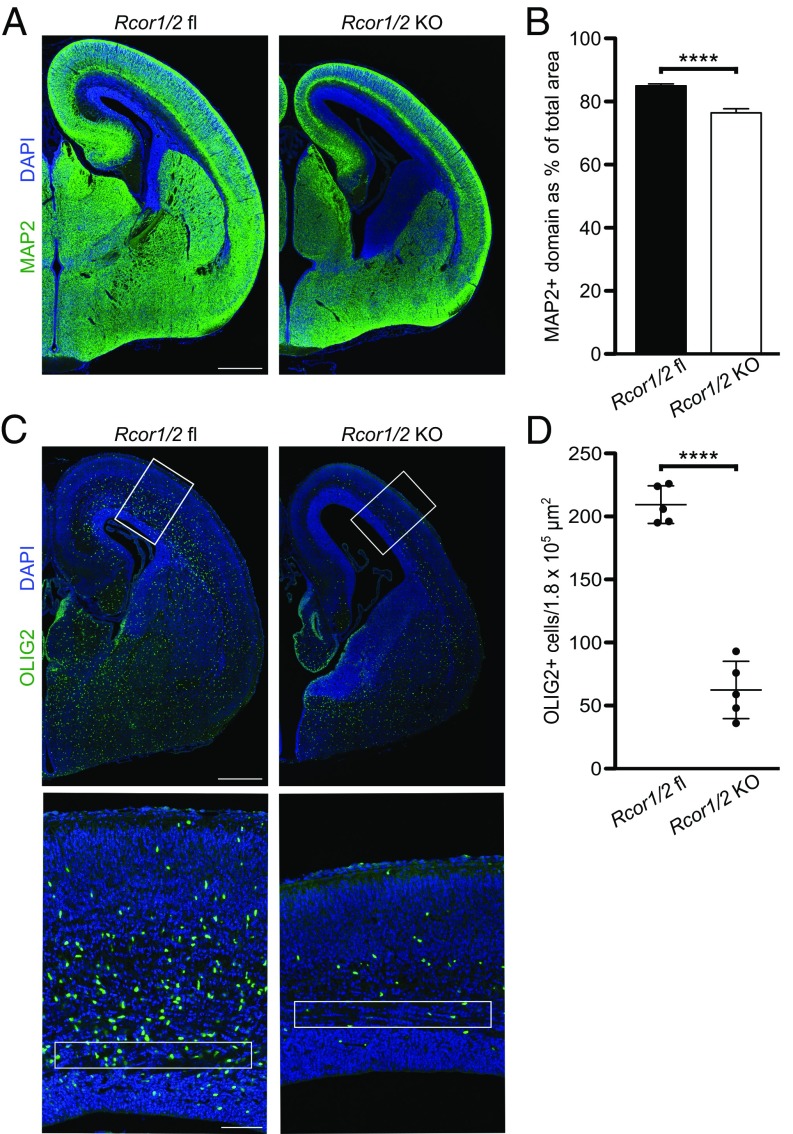
Rcor1/2 knockouts have fewer neurons and OPCs than controls. All analyses were performed on DAPI-labeled coronal sections from E18.5 brain. (A) Representative images of MAP2 immunohistochemistry. (Scale bar, 500 μm.) (B) Quantification of MAP2 immunolabeling, showing the percentage of each coronal hemisection occupied by the MAP2+ domain. The total area of the hemisection was determined on the basis of DAPI labeling. The means and SDs are indicated. Statistical significance was assessed with a t test (n = 5 mice). (C) Representative image of OLIG2 immunohistochemistry. Boxes in Top indicate regions shown below at higher magnification. Boxes in Bottom show the IZ of the neocortex. [Scale bar, 500 μm (Top) and 100 μm (Bottom).] (D) Quantification of OLIG2+ immunolabeling in the IZ of the neocortex. For each mouse, one region of 3 × 104 μm2 was selected from each of six hemisections, and the numbers of OLIG2+ cells from all regions were added. Each mouse is represented by one dot. The means and SDs are indicated. Statistical significance was assessed by t test (n = 5 mice). ****P < 0.0001.

