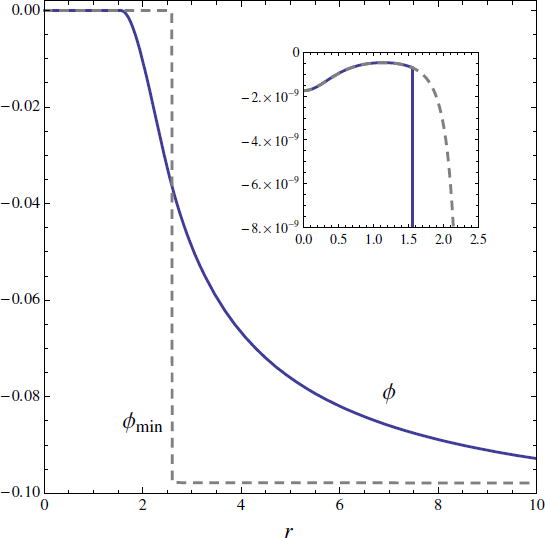
Figure 11.

The profile of the field  (in units of Mpl) versus the radius
  (denoted as r in the figure, in units of
  ) for the model (4.84) with n = 1, R∞/Rc = 3.6, and υ0 = 10−4 (shown as a solid line). The dashed line corresponds to the value ϕmin for the minimum of the effective potential. (Inset) The enlarged figure in the region
  . From [43].
